
 trustyai:
    managementState: Managed
Info alert:Important Notice
The Open Data Hub documentation and the opendatahub-documentation repository are archived as of March 2026. To see the latest documentation, go to: Red Hat OpenShift AI Self-Managed documentation.
Monitoring your AI systems
Table of Contents
Overview of monitoring your AI systems
Use TrustyAI to monitor your models for data drift and bias.
Learn how your model makes its predictions and decisions by using explainers from TrustyAI to provide saliency explanations for model inferences.
These tools help ensure that your data science and machine learning models are transparent, fair, and reliable.
Configure and set up TrustyAI for your project, and then perform the following checks:
-
Bias: Check for unfair patterns or biases in data and model predictions to ensure your model’s decisions are unbiased.
-
Data drift: Detect changes in input data distributions over time by comparing the latest real-world data to the original training data. Comparing the data identifies shifts or deviations that could impact model performance, ensuring that the model remains accurate and reliable.
-
Explainability: Understand how your model makes predictions and decisions.
Configuring TrustyAI
To configure model monitoring with TrustyAI to use in Open Data Hub, a cluster administrator does the following tasks:
-
Configure monitoring for the model serving platform
-
Enable the TrustyAI component in the Open Data Hub Operator
-
Configure TrustyAI to use a database, if you want to use your database instead of a PVC for storage with TrustyAI
-
Install the TrustyAI service on each project that contains models that the data scientists want to monitor
-
(Optional) Configure TrustyAI and KServe RawDeployment (standard deployment mode) integration
Configuring monitoring for your model serving platform
For deploying large models such as large language models (LLMs), use the model serving platform.
+ To configure monitoring for this platform, see Configuring monitoring for the model serving platform.
Enabling the TrustyAI component
To allow your data scientists to use model monitoring with TrustyAI, you must enable the TrustyAI component in Open Data Hub.
Prerequisites
-
You have cluster administrator privileges for your OpenShift Container Platform cluster.
-
You have access to the data science cluster.
-
You have installed Open Data Hub.
Procedure
-
In the OpenShift Container Platform console, click Ecosystem → Installed Operators.
-
Search for the Open Data Hub Operator, and then click the Operator name to open the Operator details page.
-
Click the Data Science Cluster tab.
-
Click the default instance name (for example, default-dsc) to open the instance details page.
-
Click the YAML tab to show the instance specifications.
-
In the
spec:componentssection, set themanagementStatefield for thetrustyaicomponent toManaged: -
Click Save.
Verification
Check the status of the trustyai-service-operator pod:
-
In the OpenShift Container Platform console, from the Project list, select opendatahub.
-
Click Workloads → Deployments.
-
Search for the trustyai-service-operator-controller-manager deployment. Check the status:
-
Click the deployment name to open the deployment details page.
-
Click the Pods tab.
-
View the pod status.
When the status of the trustyai-service-operator-controller-manager-<pod-id> pod is Running, the pod is ready to use.
-
Configuring TrustyAI with a database
If you have a relational database in your OpenShift Container Platform cluster such as MySQL or MariaDB, you can configure TrustyAI to use your database instead of a persistent volume claim (PVC). Using a database instead of a PVC for storage can improve scalability, performance, and data management in TrustyAI. Provide TrustyAI with a database configuration secret before deployment. You can create a secret or specify the name of an existing Kubernetes secret within your project.
Prerequisites
-
You have cluster administrator privileges for your OpenShift Container Platform cluster.
-
You have installed the OpenShift CLI (
oc) as described in the appropriate documentation for your cluster:-
Installing the OpenShift CLI for OpenShift Container Platform
-
Installing the OpenShift CLI for Red Hat OpenShift Service on AWS
-
-
You have enabled the TrustyAI component, as described in Enabling the TrustyAI component.
-
The data scientist has created a project, as described in Creating a project, that contains the models that the data scientist wants to monitor.
-
If you are configuring the TrustyAI service with an external MySQL database, your database must already be in your cluster and use at least MySQL version 5.x. However, Red Hat recommends that you use MySQL version 8.x.
-
If you are configuring the TrustyAI service with a MariaDB database, your database must already be in your cluster and use MariaDB version 10.3 or later. However, Red Hat recommends that you use at least MariaDB version 10.5.
|
Note
|
The transport security layer (TLS) protocol does not work with the MariaDB operator 0.29 or later versions. The MariaDB operator for |
Procedure
-
In a terminal window, if you are not already logged in to your OpenShift cluster as a cluster administrator, log in to the OpenShift CLI (
oc) as shown in the following example:$ oc login <openshift_cluster_url> -u <admin_username> -p <password> -
Optional: If you want to use a TLS connection between TrustyAI and the database, create a TrustyAI service database TLS secret that uses the same certificates that you want to use for the database.
-
Create a YAML file to contain your TLS secret and add the following code:
apiVersion: v1 kind: Secret metadata: name: <service_name>-db-tls type: kubernetes.io/tls data: tls.crt: | <TLS CERTIFICATE> tls.key: | <TLS KEY> -
Save the file with the file name <service_name>-db-tls.yaml. For example, if your service name is
trustyai-service, save the file as trustyai-service-db-tls.yaml. -
Apply the YAML file in the project that contains the models that the data scientist wants to monitor:
$ oc apply -f <service_name>-db-tls.yaml -n <project_name>
-
-
Create a secret (or specify an existing one) that has your database credentials.
-
Create a YAML file to contain your secret and add the following code:
apiVersion: v1 kind: Secret metadata: name: db-credentials type: Opaque stringData: databaseKind: <mariadb> (1) databaseUsername: <TrustyAI_username> (2) databasePassword: <TrustyAI_password> (3) databaseService: mariadb-service (4) databasePort: 3306 (5) databaseGeneration: update (6) databaseName: trustyai_service (7)-
The only currently supported
databaseKindvalue ismariadb. -
The username you want TrustyAI to use when interfacing with the database.
-
The password that TrustyAI must use when connecting to the database.
-
The Kubernetes (K8s) service that TrustyAI must use when connecting to the database (the default
mariadb) . -
The port that TrustyAI must use when connecting to the database (default is 3306).
-
The database schema generation strategy to be used by TrustyAI. It is the setting for the
quarkus.hibernate-orm.database.generationargument, which determines how TrustyAI interacts with the database on its initial connection. Set tonone,create,drop-and-create,drop,update, orvalidate. -
The name of the individual database within the database service that the username and password authenticate to, as well as the specific database name that TrustyAI should read and write to on the database server.
-
-
Save the file with the file name db-credentials.yaml. You will need this name later when you install or change the TrustyAI service.
-
Apply the YAML file in the project that contains the models that the data scientist wants to monitor:
$ oc apply -f db-credentials.yaml -n <project_name>
-
-
If you are installing TrustyAI for the first time on a project, continue to Installing the TrustyAI service for a project.
If you already installed TrustyAI on a project, you can migrate the existing TrustyAI service from using a PVC to using a database.
-
Create a YAML file to update the TrustyAI service custom resource (CR) and add the following code:
apiVersion: trustyai.opendatahub.io/v1 kind: TrustyAIService metadata: annotations: trustyai.opendatahub.io/db-migration: "true" (1) name: trustyai-service (2) spec: storage: format: "DATABASE" (3) folder: "/inputs" (4) size: "1Gi" (5) databaseConfigurations: <database_secret_credentials> (6) data: filename: "data.csv" (7) metrics: schedule: "5s" (8)-
Set to
trueto prompt the migration from PVC to database storage. -
The name of the TrustyAI service instance.
-
The storage format for the data. Set this field to
DATABASE. -
The location within the PVC where you were storing the data. This must match the value specified in the existing CR.
-
The size of the data to request.
-
The name of the secret with your database credentials that you created in an earlier step. For example,
db-credentials. -
The suffix for the existing stored data files. This must match the value specified in the existing CR.
-
The interval at which to calculate the metrics. The default is
5s. The duration is specified with the ISO-8601 format. For example,5sfor 5 seconds,5mfor 5 minutes, and5hfor 5 hours.
-
-
Save the file. For example, trustyai_crd.yaml.
-
Apply the new TrustyAI service CR to the project that contains the models that the data scientist wants to monitor:
$ oc apply -f trustyai_crd.yaml -n <project_name>
-
Installing the TrustyAI service for a project
Install the TrustyAI service on a project to provide access to its features for all models deployed within that project. An instance of the TrustyAI service is required for each project, or namespace, that contains models that the data scientists want to monitor.
Use the Open Data Hub dashboard or the OpenShift CLI (oc) to install an instance of the TrustyAI service.
|
Note
|
Install only one instance of the TrustyAI service in a project. Multiple instances in the same project can result in unexpected behavior. TrustyAI only supports models deployed with OpenVINO Model Server (OVMS). Non-OVMS models are not supported. Installing TrustyAI into a namespace where non-OVMS models are deployed can cause errors in the TrustyAI service. |
Installing the TrustyAI service by using the dashboard
You can use the Open Data Hub dashboard to install an instance of the TrustyAI service.
Prerequisites
-
A cluster administrator has configured monitoring for the model serving platform, as described in Configuring monitoring for the multi-model serving platform.
-
A cluster administrator has enabled the TrustyAI component, as described in Enabling the TrustyAI component.
-
If you are using TrustyAI with a database instead of PVC, a cluster administrator has configured TrustyAI to use the database, as described in Configuring TrustyAI with a database.
-
The data scientist has created a project, as described in Creating a project, that contains the models that the data scientist wants to monitor.
-
You have logged in to Open Data Hub as a user with Open Data Hub administrator privileges.
Procedure
-
From the Open Data Hub dashboard, click Projects.
The Projects page opens.
-
Click the name of the project that contains the models that the data scientist wants to monitor.
The project details page opens.
-
Click the Settings tab.
-
Select the Enable model bias monitoring checkbox.
Verification
-
In the OpenShift Container Platform web console, click Workloads → Pods.
-
From the project list, select the project in which you installed TrustyAI.
-
Confirm that the Pods list includes a running pod for the TrustyAI service. The pod has a naming pattern similar to the following example:
trustyai-service-5d45b5884f-96h5z
Installing the TrustyAI service by using the CLI
You can use the OpenShift CLI (oc) to install an instance of the TrustyAI service.
Prerequisites
-
You have cluster administrator privileges for your OpenShift Container Platform cluster.
-
You have installed the OpenShift CLI (
oc) as described in the appropriate documentation for your cluster:-
Installing the OpenShift CLI for OpenShift Container Platform
-
Installing the OpenShift CLI for Red Hat OpenShift Service on AWS
-
-
You have configured monitoring for the model serving platform, as described in Configuring monitoring for the multi-model serving platform.
-
You have enabled the TrustyAI component, as described in Enabling the TrustyAI component.
-
If you are using TrustyAI with a database instead of PVC, you have configured TrustyAI to use the database, as described in Configuring TrustyAI with a database.
-
The data scientist has created a project, as described in Creating a project, that contains the models that the data scientist wants to monitor.
Procedure
-
Open a new terminal window.
-
Follow these steps to log in to your OpenShift Container Platform cluster as a cluster administrator:
-
In the OpenShift Container Platform web console, click your user name and select Copy login command.
-
After you have logged in, click Display token.
-
Copy the Log in with this token command and paste it in the OpenShift CLI (
oc).$ oc login --token=<token> --server=<openshift_cluster_url>
-
-
Navigate to the project that contains the models that the data scientist wants to monitor.
oc project <project_name>For example:
oc project my-project
-
Create a
TrustyAIServicecustom resource (CR) file, for exampletrustyai_crd.yaml:Example CR file for TrustyAI using a databaseapiVersion: trustyai.opendatahub.io/v1 kind: TrustyAIService metadata: name: trustyai-service (1) spec: storage: format: "DATABASE" (2) size: "1Gi" (3) databaseConfigurations: <database_secret_credentials> (4) metrics: schedule: "5s" (5)-
The name of the TrustyAI service instance.
-
The storage format for the data, either
DATABASEorPVC(persistent volume claim). Red Hat recommends that you use a database setup for better scalability, performance, and data management in TrustyAI. -
The size of the data to request.
-
The name of the secret with your database credentials that you created in Configuring TrustyAI with a database. For example,
db-credentials. -
The interval at which to calculate the metrics. The default is
5s. The duration is specified with the ISO-8601 format. For example,5sfor 5 seconds,5mfor 5 minutes, and5hfor 5 hours.
Example CR file for TrustyAI using a PVCapiVersion: trustyai.opendatahub.io/v1 kind: TrustyAIService metadata: name: trustyai-service (1) spec: storage: format: "PVC" (2) folder: "/inputs" (3) size: "1Gi" (4) data: filename: "data.csv" (5) format: "CSV" (6) metrics: schedule: "5s" (7) batchSize: 5000 (8)-
The name of the TrustyAI service instance.
-
The storage format for the data, either
DATABASEorPVC(persistent volume claim). -
The location within the PVC where you want to store the data.
-
The size of the PVC to request.
-
The suffix for the stored data files.
-
The format of the data. Currently, only comma-separated value (CSV) format is supported.
-
The interval at which to calculate the metrics. The default is
5s. The duration is specified with the ISO-8601 format. For example,5sfor 5 seconds,5mfor 5 minutes, and5hfor 5 hours. -
(Optional) The observation’s historical window size to use for metrics calculation. The default is
5000, which means that the metrics are calculated using the 5,000 latest inferences.
-
-
Add the TrustyAI service’s CR to your project:
oc apply -f trustyai_crd.yaml
This command returns output similar to the following:
trusty-service created
Verification
Verify that you installed the TrustyAI service:
oc get pods | grep trustyai
You should see a response similar to the following:
trustyai-service-5d45b5884f-96h5z 1/1 Running
Enabling TrustyAI Integration with KServe RawDeployment
To use the TrustyAI service with KServe RawDeployment mode, you must first update the KServe ConfigMap, then create another ConfigMap in your model’s namespace to hold the Certificate Authority (CA) certificate.
Prerequisites
-
You have installed Open Data Hub.
-
You have cluster administrator privileges for your Open Data Hub cluster.
-
You have access to a data science cluster that has TrustyAI enabled.
-
You have enabled the model serving platform.
Procedure
-
Update the KServe ConfigMap (
inferenceservice-config) in the Open Data Hub UI:-
From the OpenShift console, click Workloads → ConfigMaps.
-
From the project drop-down list, select the
opendatahub-ods-applicationsnamespace. -
Find the
inferenceservice-configConfigMap. -
Click the options menu (⋮) for that ConfigMap, and then click Edit ConfigMap.
-
Add the following parameters to the logger key:
"caBundle": "kserve-logger-ca-bundle", "caCertFile": "service-ca.crt", "tlsSkipVerify": false -
Click Save.
-
-
Create a ConfigMap in your model’s namespace to hold the CA certificate:
-
Click Create Config Map.
-
Enter the following code in the created ConfigMap:
  apiVersion: v1
   kind: ConfigMap
   metadata:
     name: kserve-logger-ca-bundle
     namespace: <your-model-namespace>
     annotations:
       service.beta.openshift.io/inject-cabundle: "true"
   data: {}
-
-
Click Save.
|
Note
|
The |
Verification
When you send inferences to your KServe Raw model, TrustyAI acknowledges the data capture in the output logs.
|
Note
|
If you do not observe any data on the Trusty AI logs, complete these configuration steps and redeploy the pod. |
Setting up TrustyAI for your project
To set up model monitoring with TrustyAI for a project, a data scientist does the following tasks:
-
Authenticate the TrustyAI service
-
Upload and send training data to TrustyAI for bias or data drift monitoring
-
Label your data fields (optional)
After setting up, a data scientist can create and view bias and data drift metrics for deployed models.
Authenticating the TrustyAI service
To access TrustyAI service external endpoints, you must provide OAuth proxy (oauth-proxy) authentication. You must obtain a user token, or a token from a service account with sufficient privileges, and then pass the token to the TrustyAI service when using curl commands.
Prerequisites
-
You have installed the OpenShift CLI (
oc) as described in the appropriate documentation for your cluster:-
Installing the OpenShift CLI for OpenShift Container Platform
-
Installing the OpenShift CLI for Red Hat OpenShift Service on AWS
-
-
Your OpenShift cluster administrator added you as a user to the OpenShift Container Platform cluster and has installed the TrustyAI service for the project that contains the deployed models.
Procedure
-
Open a new terminal window.
-
Follow these steps to log in to your OpenShift Container Platform cluster:
-
In the upper-right corner of the OpenShift web console, click your user name and select Copy login command.
-
After you have logged in, click Display token.
-
Copy the Log in with this token command and paste it in the OpenShift CLI (
oc).$ oc login --token=<token> --server=<openshift_cluster_url>
-
-
Enter the following command to set a user token variable on OpenShift Container Platform:
export TOKEN=$(oc whoami -t)
Verification
-
Enter the following command to check the user token variable:
echo $TOKEN
Next step
When running curl commands, pass the token to the TrustyAI service using the Authorization header. For example:
curl -H "Authorization: Bearer $TOKEN" $TRUSTY_ROUTE
Uploading training data to TrustyAI
Upload training data to use with TrustyAI for bias monitoring or data drift detection.
Prerequisites
-
Your cluster administrator added you as a user to the OpenShift Container Platform cluster and has installed the TrustyAI service for the project that contains the deployed models.
-
You have model training data to upload.
-
You authenticated the TrustyAI service as described in Authenticating the TrustyAI service.
Procedure
-
Set the
TRUSTY_ROUTEvariable to the external route for the TrustyAI service in your project:TRUSTY_ROUTE=https://$(oc get route/trustyai-service --template={{.spec.host}}) -
Send the training data to the
/data/uploadendpoint:curl -sk $TRUSTY_ROUTE/data/upload \ --header 'Authorization: Bearer ${TOKEN}' \ --header 'Content-Type: application/json' \ -d @data/training_data.jsonThe following message is displayed if the upload was successful:
1000 datapoints successfully added to gaussian-credit-model data.
Verification
-
Verify that TrustyAI has received the data via the
/infoendpoint by inputting this query:curl -H 'Authorization: Bearer ${TOKEN}' \ $TRUSTY_ROUTE/info | jq ".[0].data"The output returns a json file containing the following information for the model:
-
The names, data types, and positions of fields in the input and output.
-
The observed values that these fields take. This value is usually
nullbecause there are too many unique feature values to enumerate. -
The total number of input-output pairs observed. It should be
1000.
-
Sending training data to TrustyAI
To use TrustyAI for bias monitoring or data drift detection, you must send training data for your model to TrustyAI.
Prerequisites
-
Your OpenShift cluster administrator added you as a user to the OpenShift Container Platform cluster and has installed the TrustyAI service for the project that contains the deployed models.
-
You authenticated the TrustyAI service as described in Authenticating the TrustyAI service.
-
You have uploaded model training data to TrustyAI.
-
Your deployed model is registered with TrustyAI.
Procedure
-
Verify that the TrustyAI service has registered your deployed model:
-
In the OpenShift Container Platform console, go to Workloads → Pods.
-
From the project list, select the project that contains your deployed model.
-
Inspect the
InferenceServicefor your deployed model. For example, run the following command:oc describe inferenceservice my-model -n my-namespace -
When inspecting the
InferenceService, you should see the following field in the specification:Logger: # ... Mode: all URL: https://trustyai-service.my-namespace.svc.cluster.local
-
-
Set the
TRUSTY_ROUTEvariable to the external route for the TrustyAI service pod:TRUSTY_ROUTE=https://$(oc get route/trustyai-service --template={{.spec.host}}) -
Get the inference endpoints for the deployed model, as described in Accessing the inference endpoint for a deployed model.
-
Send data to this endpoint. For more information, see the KServe v2 Inference Protocol documentation.
Verification
Follow these steps to view cluster metrics and verify that TrustyAI is receiving data.
-
Log in to the OpenShift Container Platform web console.
-
Switch to the Developer perspective.
-
In the left menu, click Observe.
-
On the Metrics page, click the Select query list and then select Custom query.
-
In the Expression field, enter
trustyai_model_observations_totaland press Enter. Your model should be listed and reporting observed inferences. -
Optional: Select a time range from the list above the graph. For example, select 5m.
Labeling data fields
After you send model training data to TrustyAI, you might want to apply a set of name mappings to your inputs and outputs so that the field names are meaningful and easier to work with.
Prerequisites
-
Your OpenShift cluster administrator added you as a user to the OpenShift Container Platform cluster and has installed the TrustyAI service for the project that contains the deployed models.
-
You sent training data to TrustyAI as described in Sending training data to TrustyAI.
Procedure
-
Open a new terminal window.
-
Follow these steps to log in to your OpenShift Container Platform cluster:
-
In the upper-right corner of the OpenShift web console, click your user name and select Copy login command.
-
After you have logged in, click Display token.
-
Copy the Log in with this token command and paste it in the OpenShift CLI (
oc).$ oc login --token=<token> --server=<openshift_cluster_url>
-
-
In the OpenShift CLI (
oc), get the route to the TrustyAI service:TRUSTY_ROUTE=https://$(oc get route/trustyai-service --template={{.spec.host}}) -
To examine TrustyAI’s model metadata, query the
/infoendpoint:curl -H "Authorization: Bearer $TOKEN" $TRUSTY_ROUTE/info | jq ".[0].data"This outputs a JSON file containing the following information for each model:
-
The names, data types, and positions of input fields and output fields.
-
The observed field values.
-
The total number of input-output pairs observed.
-
-
Use
POST /info/namesto apply name mappings to the fields, similar to the following example.Change the
model-name,original-name, andPredictionvalues to those used in your model. Change theNew namevalues to the labels that you want to use.curl -sk -H "Authorization: Bearer $TOKEN" -X POST --location $TRUSTY_ROUTE/info/names \ -H "Content-Type: application/json" \ -d "{ \"modelId\": \"model-name\", \"inputMapping\": { \"original-name-0\": \"New name 0\", \"original-name-1\": \"New name 1\", \"original-name-2\": \"New name 2\", \"original-name-3\": \"New name 3\", }, \"outputMapping\": { \"predict-0\": \"Prediction 0\" } }"
Verification
A "Feature and output name mapping successfully applied" message is displayed.
Monitoring model bias
As a data scientist or machine learning engineer, you can monitor your models for bias, such as algorithmic deficiencies that might skew the outcomes or decisions that the model produces. This type of monitoring can help ensure that the model is not biased against specific groups of people or personal traits.
Open Data Hub provides a set of metrics that help you to monitor your models for bias. You can use the Open Data Hub interface to choose an available metric and then configure model-specific details such as a protected attribute, the privileged and unprivileged groups, the outcome you want to monitor, and a threshold for bias. You then see a chart of the calculated values for a specified number of model inferences.
For more information about the specific bias metrics, see Using bias metrics.
Creating a bias metric
To monitor a deployed model for bias, you must first create bias metrics. When you create a bias metric, you specify details relevant to your model such as a protected attribute, privileged and unprivileged groups, a model outcome and a value that you want to monitor, and the acceptable threshold for bias.
For information about the specific bias metrics, see Using bias metrics.
For the complete list of TrustyAI metrics, see TrustyAI service API.
You can create a bias metric for a model by using the Open Data Hub dashboard or by using the OpenShift CLI (oc).
Creating a bias metric by using the dashboard
You can use the Open Data Hub dashboard to create a bias metric for a model.
Prerequisites
-
You are familiar with the bias metrics that you can use with Open Data Hub and how to interpret them.
-
You are familiar with the specific data set schema and understand the names and meanings of the inputs and outputs.
-
Your OpenShift cluster administrator added you as a user to the OpenShift Container Platform cluster and has installed the TrustyAI service for the project that contains the deployed models.
-
You set up TrustyAI for your project, as described in Setting up TrustyAI for your project.
Procedure
-
Optional: To set the
TRUSTY_ROUTEvariable, follow these steps.-
In a terminal window, log in to the OpenShift cluster where Open Data Hub is deployed.
oc login
-
Set the
TRUSTY_ROUTEvariable to the external route for the TrustyAI service pod.TRUSTY_ROUTE=https://$(oc get route/trustyai-service --template={{.spec.host}})
-
-
In the left menu of the Open Data Hub dashboard, click AI hub → Deployments.
-
On the Deployments page, select your project from the drop-down list.
-
Click the name of the model that you want to configure bias metrics for.
-
On the metrics page for the model, click the Model bias tab.
-
Click Configure.
-
In the Configure bias metrics dialog, complete the following steps to configure bias metrics:
-
In the Metric name field, type a unique name for your bias metric. Note that you cannot change the name of this metric later.
-
From the Metric type list, select one of the metrics types that are available in Open Data Hub.
-
In the Protected attribute field, type the name of an attribute in your model that you want to monitor for bias.
TipYou can use a curlcommand to query the metadata endpoint and view input attribute names and values. For example:curl -H "Authorization: Bearer $TOKEN" $TRUSTY_ROUTE/info | jq ".[0].data.inputSchema" -
In the Privileged value field, type the name of a privileged group for the protected attribute that you specified.
-
In the Unprivileged value field, type the name of an unprivileged group for the protected attribute that you specified.
-
In the Output field, type the name of the model outcome that you want to monitor for bias.
TipYou can use a curlcommand to query the metadata endpoint and view output attribute names and values. For example:curl -H "Authorization: Bearer $TOKEN" $TRUSTY_ROUTE/info | jq ".[0].data.outputSchema" -
In the Output value field, type the value of the outcome that you want to monitor for bias.
-
In the Violation threshold field, type the bias threshold for your selected metric type. This threshold value defines how far the specified metric can be from the fairness value for your metric, before the model is considered biased.
-
In the Metric batch size field, type the number of model inferences that Open Data Hub includes each time it calculates the metric.
-
-
Ensure that the values you entered are correct.
NoteYou cannot edit a model bias metric configuration after you create it. Instead, you can duplicate a metric and then edit (configure) it; however, the history of the original metric is not applied to the copy.
-
Click Configure.
Verification
-
The Bias metric configuration page shows the bias metrics that you configured for your model.
Next step
To view metrics, on the Bias metric configuration page, click View metrics in the upper-right corner.
Creating a bias metric by using the CLI
You can use the OpenShift CLI (oc) to create a bias metric for a model.
Prerequisites
-
You are familiar with the bias metrics that you can use with Open Data Hub and how to interpret them.
-
You are familiar with the specific data set schema and understand the names and meanings of the inputs and outputs.
-
Your OpenShift cluster administrator added you as a user to the OpenShift Container Platform cluster and has installed the TrustyAI service for the project that contains the deployed models.
-
You set up TrustyAI for your project, as described in Setting up TrustyAI for your project.
Procedure
-
In a terminal window, log in to the OpenShift cluster where Open Data Hub is deployed.
oc login
-
Set the
TRUSTY_ROUTEvariable to the external route for the TrustyAI service pod.TRUSTY_ROUTE=https://$(oc get route/trustyai-service --template={{.spec.host}}) -
Optionally, get the full list of TrustyAI service endpoints and payloads.
curl -H "Authorization: Bearer $TOKEN" --location $TRUSTY_ROUTE/q/openapi
-
Use
POST /metrics/group/fairness/spd/requestto schedule a recurring bias monitoring metric with the following syntax and payload structure:Syntax:
curl -sk -H "Authorization: Bearer $TOKEN" -X POST --location $TRUSTY_ROUTE/metrics/group/fairness/spd/request  \
 --header 'Content-Type: application/json' \
 --data <payload>
Payload structure:
modelId-
The name of the model to query.
protectedAttribute-
The name of the feature that distinguishes the groups that you are checking for fairness.
privilegedAttribute-
The suspected favored (positively biased) class.
unprivilegedAttribute-
The suspected unfavored (negatively biased) class.
outcomeName-
The name of the output that provides the output you are examining for fairness.
favorableOutcome-
The value of the
outcomeNameoutput that describes the favorable or desired model prediction. batchSize-
The number of previous inferences to include in the calculation.
For example:
curl -sk -H "Authorization: Bearer $TOKEN" -X POST --location $TRUSTY_ROUTE /metrics/group/fairness/spd/request \
     --header 'Content-Type: application/json' \
     --data "{
                 \"modelId\": \"demo-loan-nn-onnx-alpha\",
                 \"protectedAttribute\": \"Is Male-Identifying?\",
                 \"privilegedAttribute\": 1.0,
                 \"unprivilegedAttribute\": 0.0,
                 \"outcomeName\": \"Will Default?\",
                 \"favorableOutcome\": 0,
                 \"batchSize\": 5000
             }"
Verification
The bias metrics request should return output similar to the following:
{
   "timestamp":"2023-10-24T12:06:04.586+00:00",
   "type":"metric",
   "value":-0.0029676404469311524,
   "namedValues":null,
   "specificDefinition":"The SPD of -0.002968 indicates that the likelihood of Group:Is Male-Identifying?=1.0 receiving Outcome:Will Default?=0 was -0.296764 percentage points lower than that of Group:Is Male-Identifying?=0.0.",
   "name":"SPD",
   "id":"d2707d5b-cae9-41aa-bcd3-d950176cbbaf",
   "thresholds":{"lowerBound":-0.1,"upperBound":0.1,"outsideBounds":false}
}
The specificDefinition field helps you understand the real-world interpretation of these metric values. For this example, the model is fair over the Is Male-Identifying? field, with the rate of positive outcome only differing by about -0.3%.
Duplicating a bias metric
If you want to edit an existing metric, you can duplicate (copy) it in the Open Data Hub interface and then edit the values in the copy. However, note that the history of the original metric is not applied to the copy.
Prerequisites
-
You are familiar with the bias metrics that you can use with Open Data Hub and how to interpret them.
-
You are familiar with the specific data set schema and understand the names and meanings of the inputs and outputs.
-
There is an existing bias metric that you want to duplicate.
Procedure
-
In the left menu of the Open Data Hub dashboard, click AI hub → Deployments.
-
On the Deployments page, click the name of the model with the bias metric that you want to duplicate.
-
On the metrics page for the model, click the Model bias tab.
-
Click Configure.
-
On the Bias metric configuration page, click the action menu (⋮) next to the metric that you want to copy and then click Duplicate.
-
In the Configure bias metric dialog, follow these steps:
-
In the Metric name field, type a unique name for your bias metric. Note that you cannot change the name of this metric later.
-
Change the values of the fields as needed. For a description of these fields, see Creating a bias metric by using the dashboard.
-
-
Ensure that the values you entered are correct, and then click Configure.
Verification
-
The Bias metric configuration page shows the bias metrics that you configured for your model.
Next step
To view metrics, on the Bias metric configuration page, click View metrics in the upper-right corner.
Deleting a bias metric
You can delete a bias metric for a model by using the Open Data Hub dashboard or by using the OpenShift CLI (oc).
Deleting a bias metric by using the dashboard
You can use the Open Data Hub dashboard to delete a bias metric for a model.
Prerequisites
-
You have logged in to Open Data Hub.
-
There is an existing bias metric that you want to delete.
Procedure
-
In the left menu of the Open Data Hub dashboard, click AI hub → Deployments.
-
On the Deployments page, click the name of the model with the bias metric that you want to delete.
-
On the metrics page for the model, click the Model bias tab.
-
Click Configure.
-
Click the action menu (⋮) next to the metric that you want to delete and then click Delete.
-
In the Delete bias metric dialog, type the metric name to confirm the deletion.
NoteYou cannot undo deleting a bias metric.
-
Click Delete bias metric.
Verification
-
The Bias metric configuration page does not show the bias metric that you deleted.
Deleting a bias metric by using the CLI
You can use the OpenShift CLI (oc) to delete a bias metric for a model.
Prerequisites
-
You have installed the OpenShift CLI (
oc) as described in the appropriate documentation for your cluster:-
Installing the OpenShift CLI for OpenShift Container Platform
-
Installing the OpenShift CLI for Red Hat OpenShift Service on AWS
-
-
You have a user token for authentication as described in Authenticating the TrustyAI service.
-
There is an existing bias metric that you want to delete.
Procedure
-
Open a new terminal window.
-
Follow these steps to log in to your OpenShift Container Platform cluster:
-
In the upper-right corner of the OpenShift web console, click your user name and select Copy login command.
-
After you have logged in, click Display token.
-
Copy the Log in with this token command and paste it in the OpenShift CLI (
oc).$ oc login --token=<token> --server=<openshift_cluster_url>
-
-
In the OpenShift CLI (
oc), get the route to the TrustyAI service:TRUSTY_ROUTE=https://$(oc get route/trustyai-service --template={{.spec.host}}) -
Optional: To list all currently active requests for a metric, use
GET /metrics/{{metric}}/requests. For example, to list all currently scheduled SPD metrics, type:curl -H "Authorization: Bearer $TOKEN" -X GET --location "$TRUSTY_ROUTE/metrics/spd/requests"
Alternatively, to list all currently scheduled metric requests, use
GET /metrics/all/requests.curl -H "Authorization: Bearer $TOKEN" -X GET --location "$TRUSTY_ROUTE/metrics/all/requests"
-
To delete a metric, send an HTTP
DELETErequest to the/metrics/$METRIC/requestendpoint to stop the periodic calculation, including the id of periodic task that you want to cancel in the payload. For example:curl -H "Authorization: Bearer $TOKEN" -X DELETE --location "$TRUSTY_ROUTE/metrics/spd/request" \ -H "Content-Type: application/json" \ -d "{ \"requestId\": \"3281c891-e2a5-4eb3-b05d-7f3831acbb56\" }"
Verification
Use GET /metrics/{{metric}}/requests to list all currently active requests for the metric and verify the metric that you deleted is not shown. For example:
curl -H "Authorization: Bearer $TOKEN" -X GET --location "$TRUSTY_ROUTE/metrics/spd/requests"
Viewing bias metrics for a model
After you create bias monitoring metrics, you can use the Open Data Hub dashboard to view and update the metrics that you configured.
Prerequisite
-
You configured bias metrics for your model as described in Creating a bias metric.
Procedure
-
In the Open Data Hub dashboard, click AI hub → Deployments.
-
On the Deployments page, click the name of a model that you want to view bias metrics for.
-
On the metrics page for the model, click the Model bias tab.
-
To update the metrics shown on the page, follow these steps:
-
In the Metrics to display section, use the Select a metric list to select a metric to show on the page.
NoteEach time you select a metric to show on the page, an additional Select a metric list is displayed. This enables you to show multiple metrics on the page. -
From the Time range list in the upper-right corner, select a value.
-
From the Refresh interval list in the upper-right corner, select a value.
The metrics page shows the metrics that you selected.
-
-
Optional: To remove one or more metrics from the page, in the Metrics to display section, perform one of the following actions:
-
To remove an individual metric, click the cancel icon (✖) next to the metric name.
-
To remove all metrics, click the cancel icon (✖) in the Select a metric list.
-
-
Optional: To return to configuring bias metrics for the model, on the metrics page, click Configure in the upper-right corner.
Verification
-
The metrics page shows the metrics selections that you made.
Using bias metrics
You can use the following bias metrics in Open Data Hub:
- Statistical Parity Difference
-
Statistical Parity Difference (SPD) is the difference in the probability of a favorable outcome prediction between unprivileged and privileged groups. The formal definition of SPD is the following:

-
ŷ = 1 is the favorable outcome.
-
Dᵤ and Dₚ are the unprivileged and privileged group data.
You can interpret SPD values as follows:
-
A value of
0means that the model is behaving fairly for a selected attribute (for example, race, gender). -
A value in the range
-0.1to0.1means that the model is reasonably fair for a selected attribute. Instead, you can attribute the difference in probability to other factors, such as the sample size. -
A value outside the range
-0.1to0.1indicates that the model is unfair for a selected attribute. -
A negative value indicates that the model has bias against the unprivileged group.
-
A positive value indicates that the model has bias against the privileged group.
-
- Disparate Impact Ratio
-
Disparate Impact Ratio (DIR) is the ratio of the probability of a favorable outcome prediction for unprivileged groups to that of privileged groups. The formal definition of DIR is the following:
-
ŷ = 1 is the favorable outcome.
-
Dᵤ and Dₚ are the unprivileged and privileged group data.
The threshold to identify bias depends on your own criteria and specific use case.
For example, if your threshold for identifying bias is represented by a DIR value below
0.8or above1.2, you can interpret the DIR values as follows:-
A value of
1means that the model is fair for a selected attribute. -
A value of between
0.8and1.2means that the model is reasonably fair for a selected attribute. -
A value below
0.8or above1.2indicates bias.
-
Bias monitoring tutorial - Gender bias example
Step-by-step guidance for using TrustyAI in Open Data Hub to monitor machine learning models for bias.
Introduction
Ensuring that your machine learning models are fair and unbiased is essential for building trust with your users. Although you can assess fairness during model training, it is only in deployment that your models use real-world data. Even if your models are unbiased on training data, they can exhibit serious biases in real-world scenarios. Therefore, it is crucial to monitor your models for fairness during their real-world deployment.
In this tutorial, you learn how to monitor models for bias. You will use two example models to complete the following tasks:
-
Deploy the models by using multi-model serving.
-
Send training data to the models.
-
Examine the metadata for the models.
-
Check model fairness.
-
Schedule and check fairness and identity metric requests.
-
Simulate real-world data.
About the example models
For this tutorial, your role is a DevOps engineer for a credit lending company. The company’s data scientists have created two candidate neural network models to predict whether a borrower will default on a loan. Both models make predictions based on the following information from the borrower’s application:
-
Number of Children
-
Total Income
-
Number of Total Family Members
-
Is Male-Identifying?
-
Owns Car?
-
Owns Realty?
-
Is Partnered?
-
Is Employed?
-
Lives with Parents?
-
Age (in days)
-
Length of Employment (in days)
As the DevOps engineer, your task is to verify that the models are not biased against the Is Male-Identifying? gender field. To complete this task, you can monitor the models by using the Statistical Parity Difference (SPD) metric, which reports whether there is a difference between how often male-identifying and non-male-identifying applicants are given favorable predictions (that is, they are predicted to pay off their loans). An ideal SPD metric is 0, meaning both groups are equally likely to receive a positive outcome. An SPD between -0.1 and 0.1 also indicates fairness, as it reflects only a +/-10% variation between the groups.
Setting up your environment
To set up your environment for this tutorial, complete the following tasks:
-
Download tutorial files from the trustyai-explainability repository.
-
Log in to the OpenShift cluster from the command line.
-
Configure monitoring for the model serving platform.
-
Enable the TrustyAI component in the Open Data Hub Operator.
-
Set up a project.
-
Authenticate the TrustyAI service.
Prerequisites
-
The Open Data Hub Operator is installed on your OpenShift Container Platform cluster.
-
You have cluster administrator privileges for your OpenShift Container Platform cluster.
-
You have installed the OpenShift CLI (
oc) as described in the appropriate documentation for your cluster:-
Installing the OpenShift CLI for OpenShift Container Platform
-
Installing the OpenShift CLI for Red Hat OpenShift Service on AWS
-
Downloading the tutorial files
-
Go to https://github.com/trustyai-explainability/odh-trustyai-demos/tree/main.
-
Click the Code button and then click Download ZIP to download the repository.
-
Extract the downloaded repository files.
Logging in to the OpenShift cluster from the command line
-
Obtain the command for logging in to the OpenShift cluster from the command line:
-
In the upper-right corner of the OpenShift Container Platform web console, click your user name and select Copy login command.
-
Log in with your credentials and then click Display token.
-
Copy the Log in with this token command, which has the following syntax:
$ oc login --token=<token> --server=<openshift_cluster_url>
-
-
In a terminal window, paste and run the login command.
Configuring monitoring for the model serving platform
To enable monitoring on user-defined projects, you must configure monitoring for the model serving platform.
-
Run the following command from the directory containing the downloaded tutorial files (
odh-trustyai-demos-main):oc apply -f 1-Installation/resources/enable_uwm.yaml -
To configure monitoring to store metric data for 15 days, run the following command from the directory containing the downloaded tutorial files (
odh-trustyai-demos-main):oc apply -f 1-Installation/resources/uwm_configmap.yaml
For more information, see Configuring monitoring for the multi-model serving platform.
Enabling the TrustyAI component
To allow your data scientists to use model monitoring with TrustyAI, you must enable the TrustyAI component in Open Data Hub.
Prerequisites
-
You have cluster administrator privileges for your OpenShift Container Platform cluster.
-
You have access to the data science cluster.
-
You have installed Open Data Hub.
Procedure
-
In the OpenShift Container Platform console, click Ecosystem → Installed Operators.
-
Search for the Open Data Hub Operator, and then click the Operator name to open the Operator details page.
-
Click the Data Science Cluster tab.
-
Click the default instance name (for example, default-dsc) to open the instance details page.
-
Click the YAML tab to show the instance specifications.
-
In the
spec:componentssection, set themanagementStatefield for thetrustyaicomponent toManaged:trustyai: managementState: Managed -
Click Save.
Verification
Check the status of the trustyai-service-operator pod:
-
In the OpenShift Container Platform console, from the Project list, select opendatahub.
-
Click Workloads → Deployments.
-
Search for the trustyai-service-operator-controller-manager deployment. Check the status:
-
Click the deployment name to open the deployment details page.
-
Click the Pods tab.
-
View the pod status.
When the status of the trustyai-service-operator-controller-manager-<pod-id> pod is Running, the pod is ready to use.
-
Setting up a project
For this tutorial, you must create a project named model-namespace.
-
To create a new project named
model-namespace, run the following command from the directory containing the downloaded tutorial files (odh-trustyai-demos-main):oc new-project model-namespace -
Prepare the
model-namespaceproject for multi-model serving:oc label namespace model-namespace "modelmesh-enabled=true" --overwrite=true
Authenticating the TrustyAI service
TrustyAI endpoints are authenticated with a Bearer token. To obtain this token and set a variable (TOKEN) to use later, run the following command:
export TOKEN=$(oc whoami -t)Deploying models
Procedure
To deploy the models for this tutorial, run the following commands from the directory containing the downloaded tutorial files (odh-trustyai-demos-main).
-
Navigate to the
model-namespaceproject you created:oc project model-namespace -
Deploy the model’s storage container:
oc apply -f 2-BiasMonitoring/resources/model_storage_container.yaml -
Deploy the OVMS 1.x serving runtime:
oc apply -f 2-BiasMonitoring/resources/ovms-1.x.yaml -
Deploy the first model:
oc apply -f 2-BiasMonitoring/resources/model_alpha.yaml -
Deploy the second model:
oc apply -f 2-BiasMonitoring/resources/model_beta.yaml
Verification
-
In the OpenShift Container Platform console, click Workloads → Pods.
-
Confirm that there are four pods:
-
minio -
modelmesh-serving-ovms-1.x-xxxxxxxxxx-xxxxx -
modelmesh-serving-ovms-1.x-xxxxxxxxxx-xxxxx -
trustyai-service-xxxxxxxxxx-xxxxxWhen the TrustyAI service has registered the deployed models, the
modelmesh-serving-ovms-1.x-xxxxxpods are redeployed.
-
-
To verify that TrustyAI has registered the models:
-
Select one of the
modelmesh-serving-ovms-1.x-xxxxxpods. -
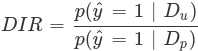
Click the Environment tab and confirm that the
MM_PAYLOAD_PROCESSORSfield is set.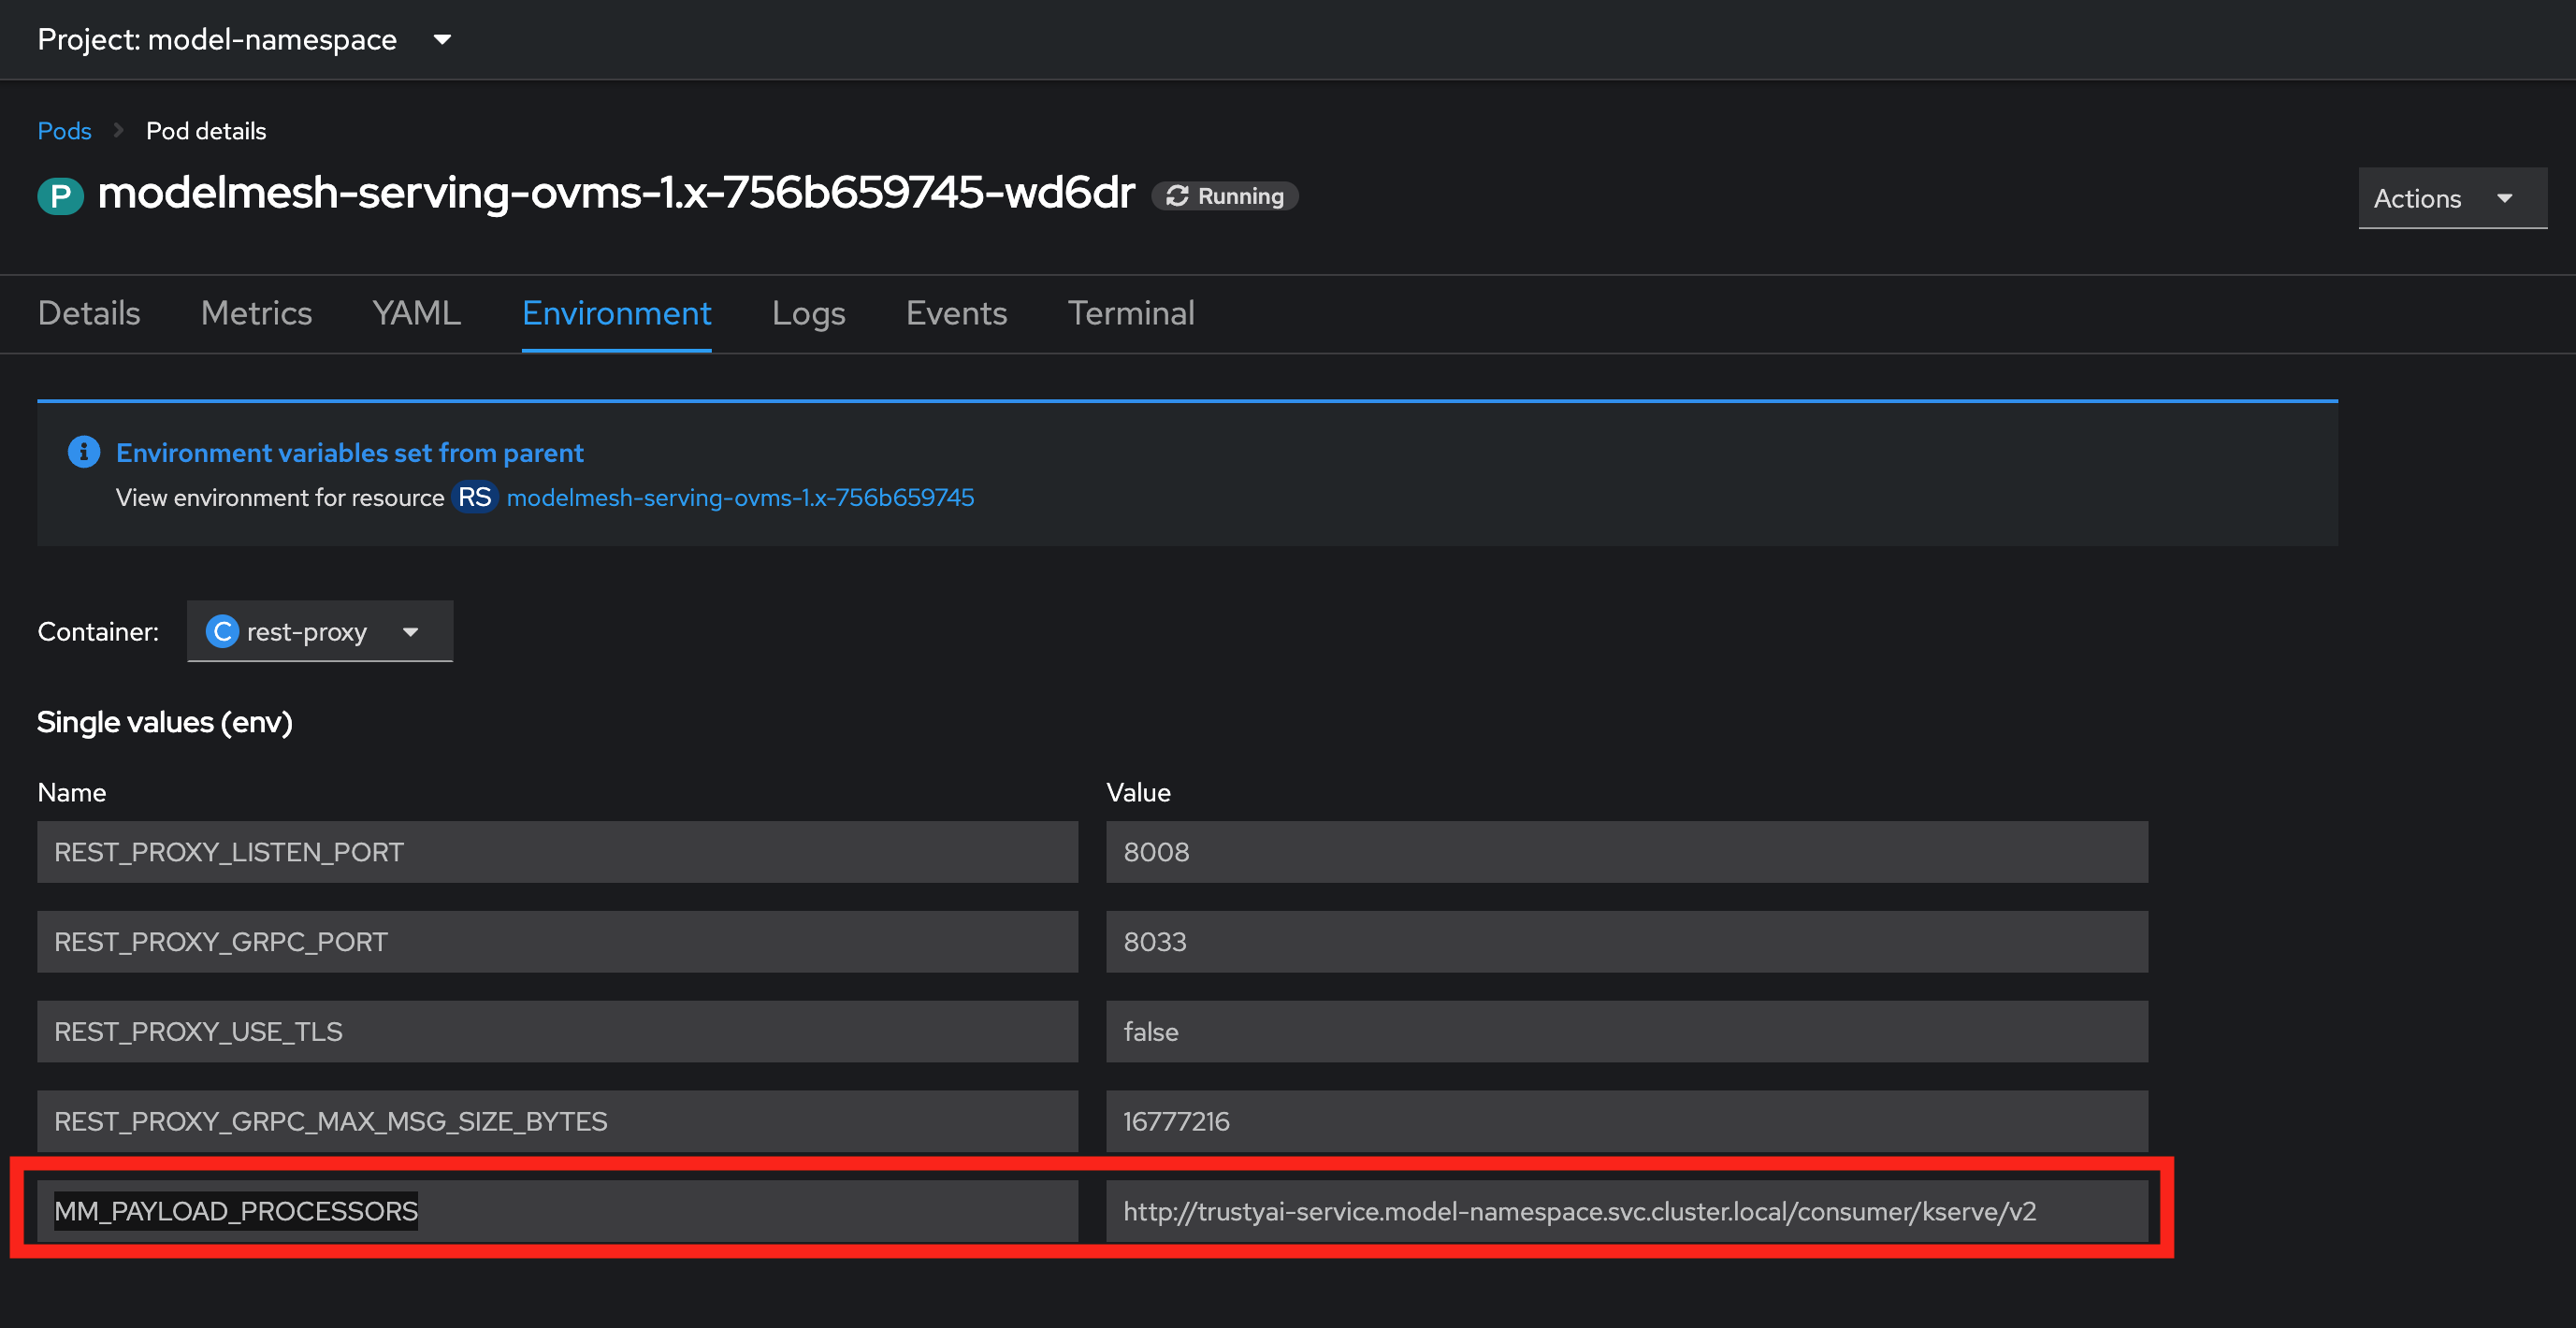
-
Sending training data to the models
Pass the training data through the models.
Procedure
-
In a terminal window, run the following command from the directory that contains the downloaded tutorial files (
odh-trustyai-demos-main):for batch in 0 250 500 750 1000 1250 1500 1750 2000 2250; do 2-BiasMonitoring/scripts/send_data_batch 2-BiasMonitoring/data/training/$batch.json doneThis process can take several minutes.
Verification
-
View the script verification messages that indicate whether TrustyAI is receiving the data.
-
Verify that the process is running by viewing the cluster metrics:
-
In the OpenShift Container Platform web console, click Observe → Metrics.
-
In the Expression field, enter
trustyai_model_observations_totaland click Run Queries. -
Confirm that both models are listed with around 2250 inferences each, which indicates that TrustyAI has cataloged enough inputs and outputs to begin analysis.
-
Optional: You can select a time range and refresh interval:
-
From the Time range list, select 5 minutes.
-
From the Refresh interval list, select 15 seconds.
-
-
-
Verify that TrustyAI can access the models by examining the model metadata:
-
Find the route to the TrustyAI service:
TRUSTY_ROUTE=https://$(oc get route/trustyai-service --template={{.spec.host}}); echo $TRUSTY_ROUTE -
Query the
/infoendpoint:curl -H "Authorization: Bearer ${TOKEN}" $TRUSTY_ROUTE/info | jqA JSON file is generated with the following information for each model:
-
The names, data types, and positions of fields in the input and output.
-
The observed values that these fields take.
-
The total number of input-output pairs observed.
-
For an example output file, see the
odh-trustyai-demos-main/2-BiasMonitoring/scripts/info_response.jsonfile in your downloaded tutorial files. -
Labeling data fields
You can apply name mappings to your inputs and outputs for more meaningful field names by sending a POST request to the /info/names endpoint.
For this tutorial, run the following command from the directory containing the downloaded tutorial files (odh-trustyai-demos-main):
2-BiasMonitoring/scripts/apply_name_mapping.shFor general steps, see Labeling data fields.
To understand the payload structure, see the odh-trustyai-demos-main/2-BiasMonitoring/scripts/apply_name_mapping.sh file in your downloaded tutorial files.
Checking model fairness
Compute the model’s cumulative fairness up to this point.
Procedure
-
In a terminal window, run the following script from the directory containing the downloaded tutorial files (
odh-trustyai-demos-main) to check the/metrics/group/fairness/spdendpoint:echo -e "=== MODEL ALPHA ===" curl -sk -H "Authorization: Bearer ${TOKEN}" -X POST --location $TRUSTY_ROUTE/metrics/group/fairness/spd/ \ --header 'Content-Type: application/json' \ --data "{ \"modelId\": \"demo-loan-nn-onnx-alpha\", \"protectedAttribute\": \"Is Male-Identifying?\", \"privilegedAttribute\": 1.0, \"unprivilegedAttribute\": 0.0, \"outcomeName\": \"Will Default?\", \"favorableOutcome\": 0, \"batchSize\": 5000 }" | jq echo -e "\n\n=== MODEL BETA ===" curl -sk -H "Authorization: Bearer ${TOKEN}" -X POST --location $TRUSTY_ROUTE/metrics/group/fairness/spd \ --header 'Content-Type: application/json' \ --data "{ \"modelId\": \"demo-loan-nn-onnx-beta\", \"protectedAttribute\": \"Is Male-Identifying?\", \"privilegedAttribute\": 1.0, \"unprivilegedAttribute\": 0.0, \"outcomeName\": \"Will Default?\", \"favorableOutcome\": 0, \"batchSize\": 5000 }" | jq echo
The payload structure is as follows:
-
modelId: The name of the model to query. -
protectedAttribute: The name of the feature that distinguishes the groups that you are checking for fairness over. -
privilegedAttribute: The value of theprotectedAttributethat describes the suspected favored (positively biased) class. -
unprivilegedAttribute: The value of theprotectedAttributethat describes the suspected unfavored (negatively biased) class. -
outcomeName: The name of the output that provides the output you are examining for fairness. -
favorableOutcome: The value of theoutcomeNameoutput that describes the favorable model prediction. -
batchSize: The number of previous inferences to include in the calculation.
Verification
Confirm that you see outputs similar to the following examples:
- Model Alpha
=== MODEL ALPHA ===
{
  "timestamp": "2024-07-25T16:26:50.412+00:00",
  "type": "metric",
  "value": 0.003056835834369387,
  "namedValues": null,
  "specificDefinition": "The SPD of 0.003057 indicates that the likelihood of Group:Is Male-Identifying?=[1.0] receiving Outcome:Will Default?=[0] was 0.305684 percentage points higher than that of Group:Is Male-Identifying?=[0.0].",
  "name": "SPD",
  "id": "542bd51e-dd2f-40f6-947f-c1c22bd71765",
  "thresholds": {
    "lowerBound": -0.1,
    "upperBound": 0.1,
    "outsideBounds": false
  }
}- Model Beta
=== MODEL BETA ===
{
  "timestamp": "2024-07-25T16:26:50.648+00:00",
  "type": "metric",
  "value": 0.029078518433627354,
  "namedValues": null,
  "specificDefinition": "The SPD of 0.029079 indicates that the likelihood of Group:Is Male-Identifying?=[1.0] receiving Outcome:Will Default?=[0] was 2.907852 percentage points higher than that of Group:Is Male-Identifying?=[0.0].",
  "name": "SPD",
  "id": "df292f06-9255-4158-8b02-4813a8777b7b",
  "thresholds": {
    "lowerBound": -0.1,
    "upperBound": 0.1,
    "outsideBounds": false
  }
}
The specificDefinition field is important in understanding the real-world interpretation of these metric values; you can see that both model Alpha and Beta are fair over the Is Male-Identifying field, with the two groups' rates of positive outcomes only differing by -0.3% for model Alpha and 2.8% for model Beta.
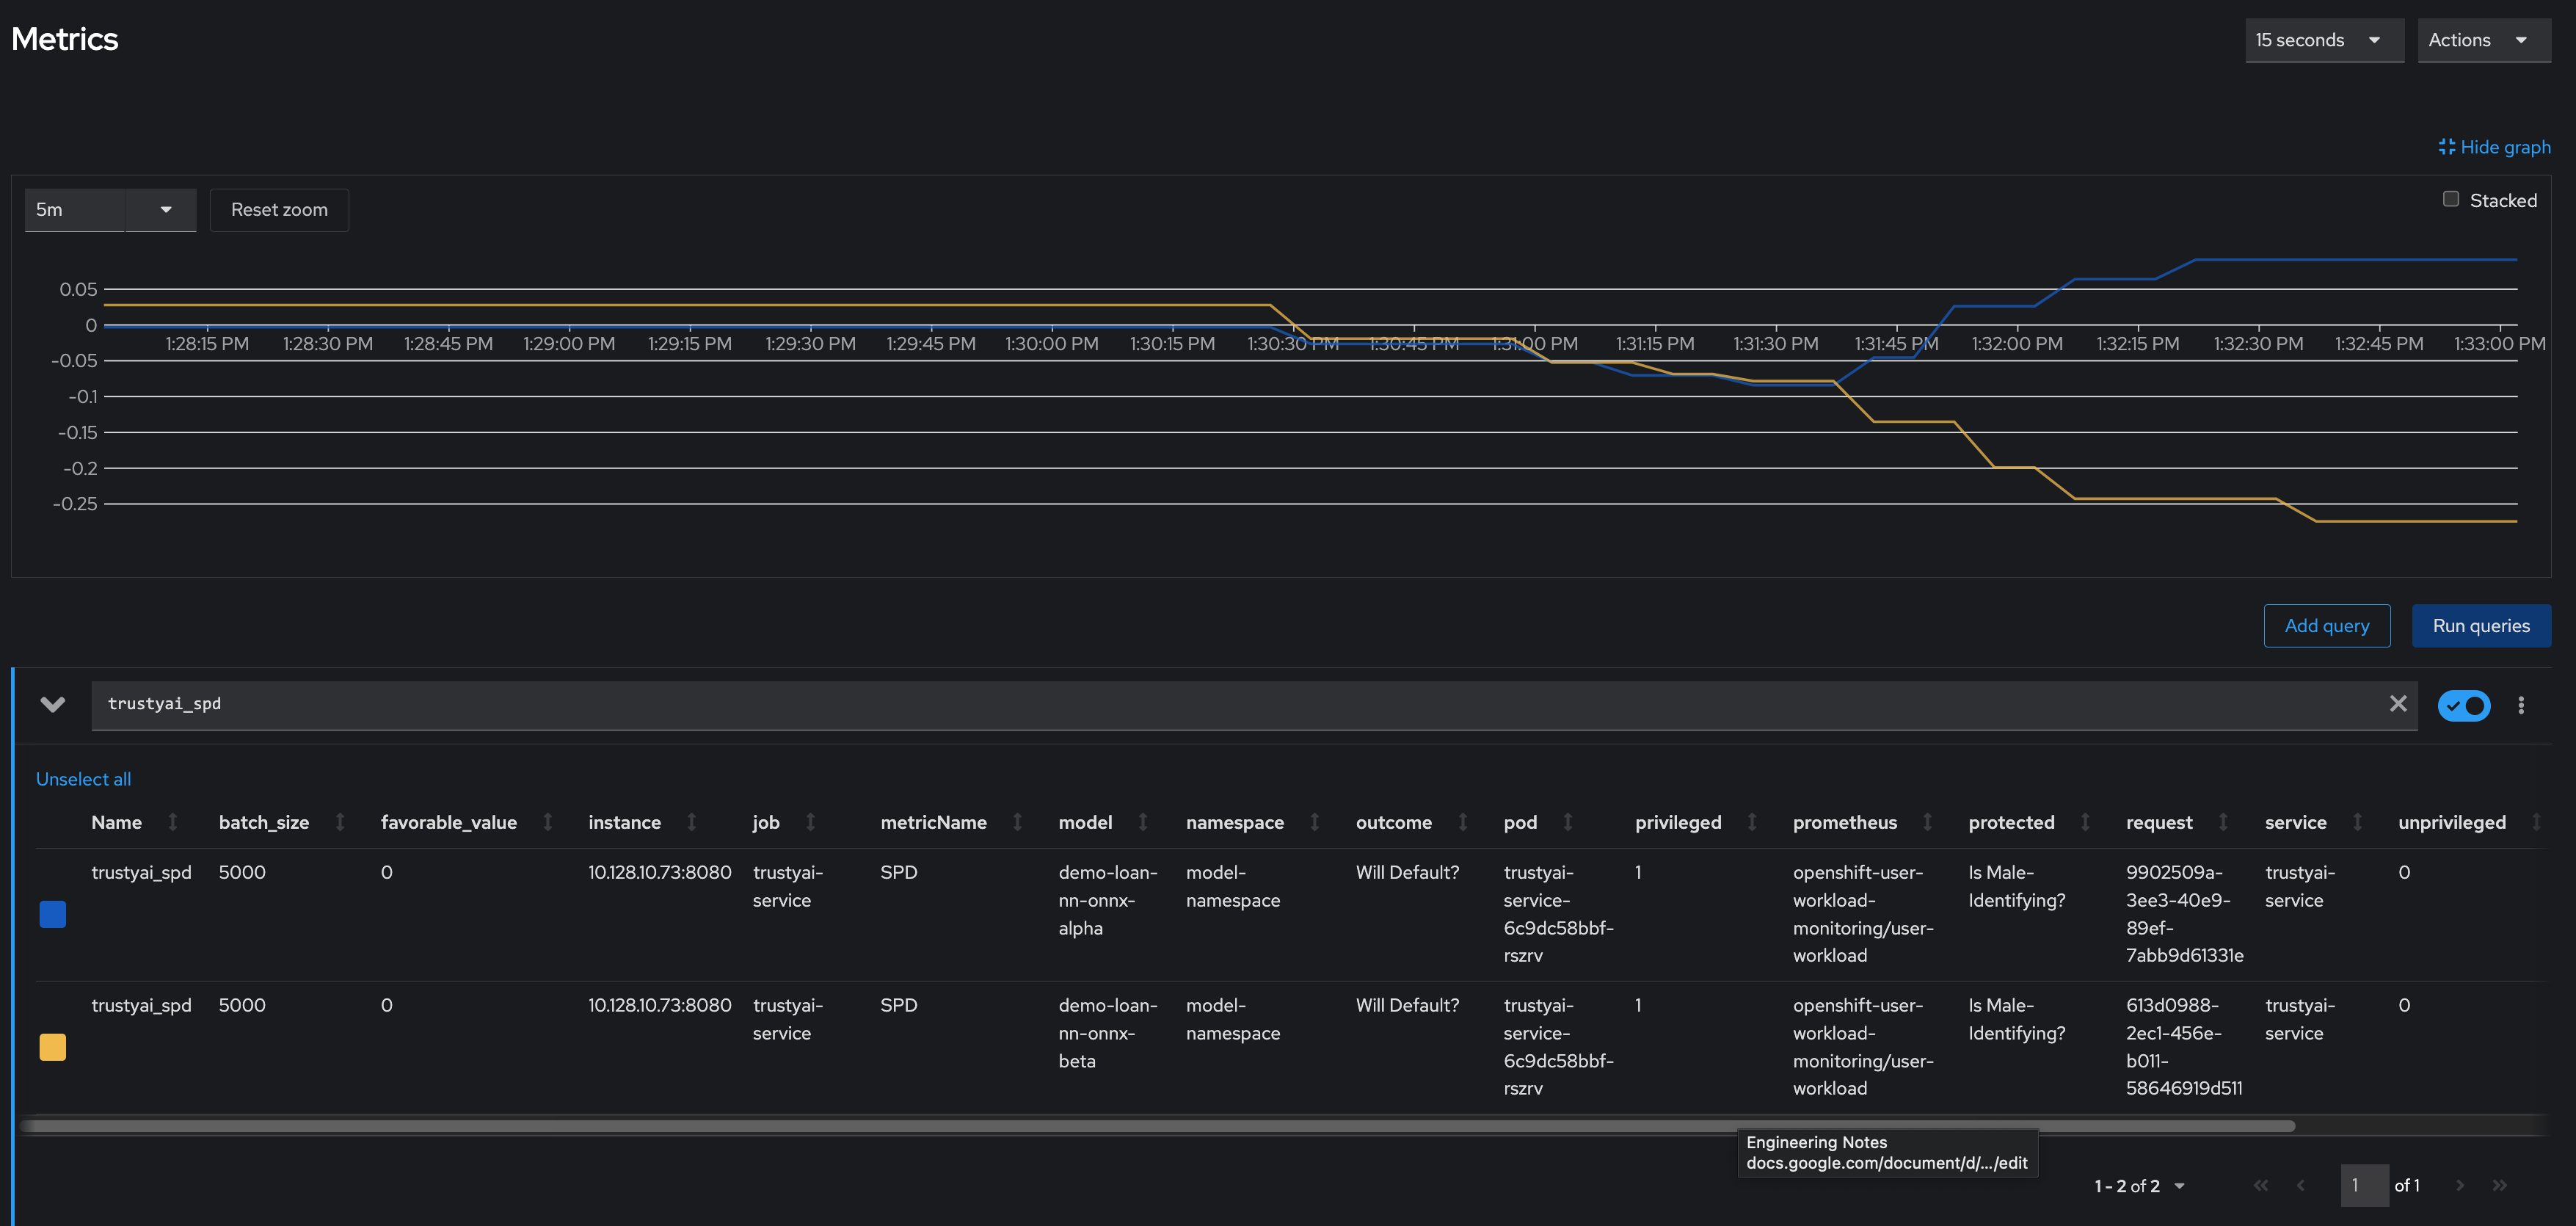
Scheduling a fairness metric request
After you confirm that the models are fair over the training data, you want to ensure that they remain fair over real-world inference data. To monitor their fairness, you can schedule a metric request to compute at recurring intervals throughout deployment by passing the same payloads to the /metrics/group/fairness/spd/request endpoint.
Procedure
-
In a terminal window, run the following script from the directory containing the downloaded tutorial files (
odh-trustyai-demos-main):echo -e "\n\n=== MODEL ALPHA ===\n" curl -sk -H "Authorization: Bearer ${TOKEN}" -X POST --location $TRUSTY_ROUTE/metrics/group/fairness/spd/request \ --header 'Content-Type: application/json' \ --data "{ \"modelId\": \"demo-loan-nn-onnx-alpha\", \"protectedAttribute\": \"Is Male-Identifying?\", \"privilegedAttribute\": 1.0, \"unprivilegedAttribute\": 0.0, \"outcomeName\": \"Will Default?\", \"favorableOutcome\": 0, \"batchSize\": 5000 }" echo -e "\n\n=== MODEL BETA ===\n" curl -sk -H "Authorization: Bearer ${TOKEN}" -X POST --location $TRUSTY_ROUTE/metrics/group/fairness/spd/request \ --header 'Content-Type: application/json' \ --data "{ \"modelId\": \"demo-loan-nn-onnx-beta\", \"protectedAttribute\": \"Is Male-Identifying?\", \"privilegedAttribute\": 1.0, \"unprivilegedAttribute\": 0.0, \"outcomeName\": \"Will Default?\", \"favorableOutcome\": 0, \"batchSize\": 5000 }" echo
These commands return the IDs of the created requests. Later, you can use these IDs to delete the scheduled requests.
Verification
-
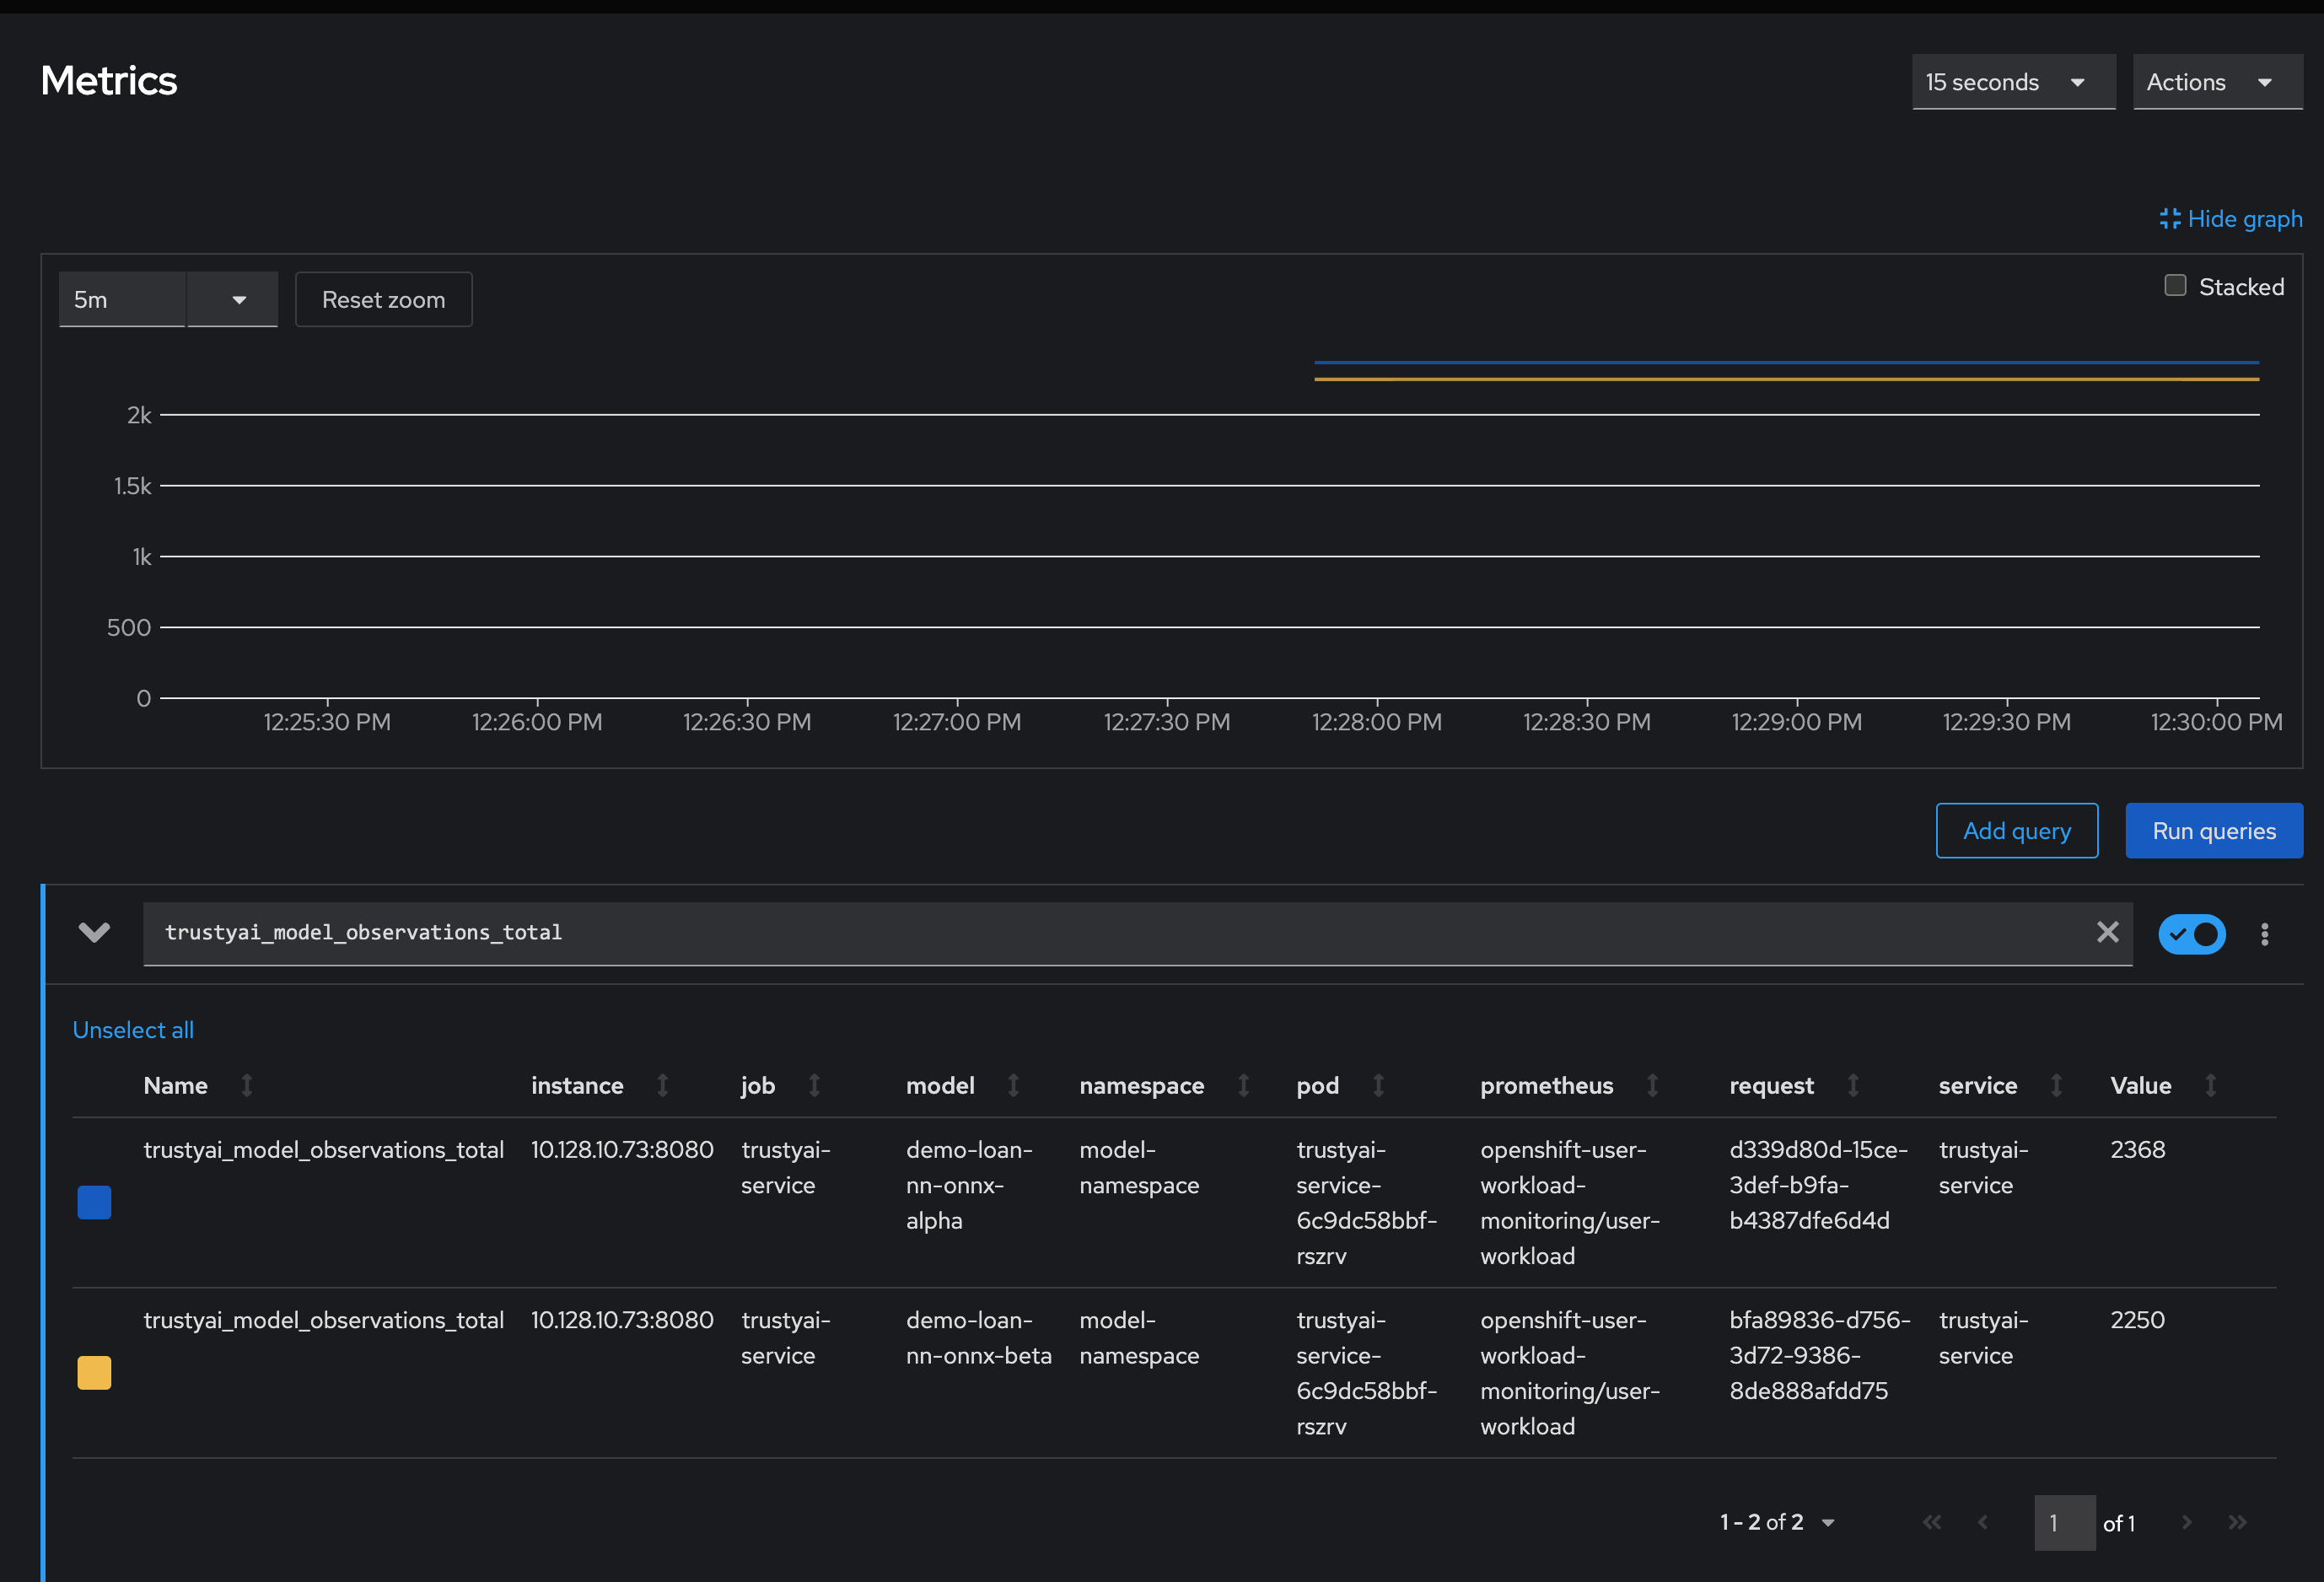
In the OpenShift Container Platform web console, click Observe → Metrics.
-
In the Expression field, enter
trustyai_spdand click Run Queries. -
Optional: After running a query, you can select a time range and refresh interval:
-
From the Time range list, select 5 minutes.
-
From the Refresh interval list, select 15 seconds.
-
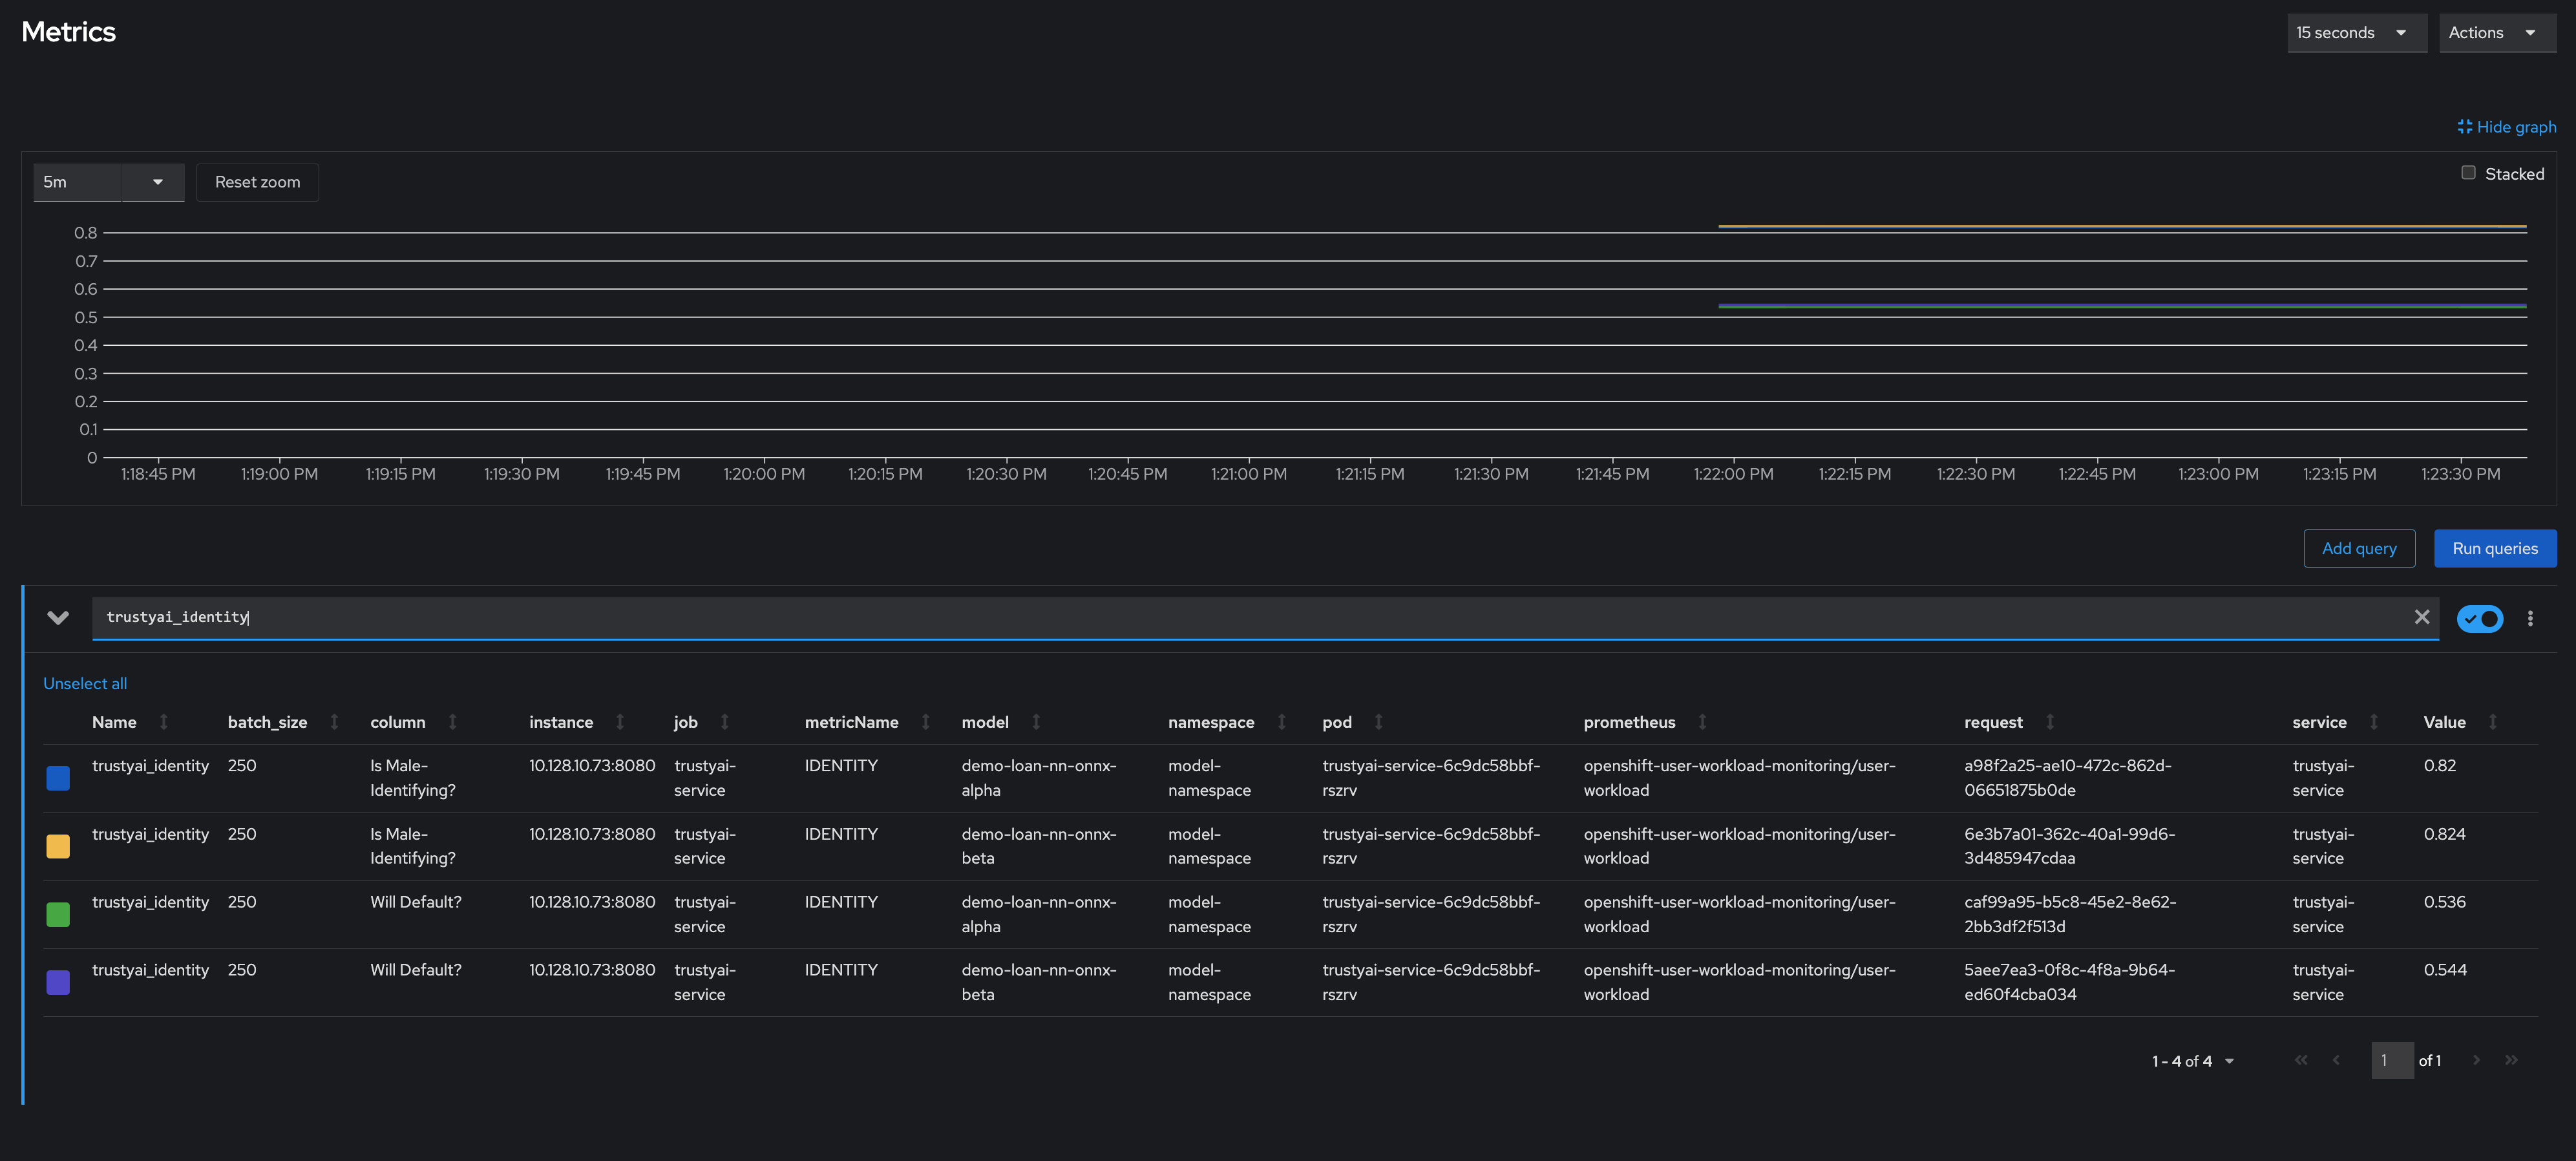
Scheduling an identity metric request
You can monitor the average values of various data fields over time to see the average ratio of loan-payback to loan-default predictions and the average ratio of male-identifying to non-male-identifying applicants. To monitor the average values, you create an identity metric request by sending a POST request to the /metrics/identity/request endpoint.
Procedure
-
In a terminal window, run the following command from the directory containing the downloaded tutorial files (
odh-trustyai-demos-main):for model in "demo-loan-nn-onnx-alpha" "demo-loan-nn-onnx-beta"; do for field in "Is Male-Identifying?" "Will Default?"; do curl -sk -H "Authorization: Bearer ${TOKEN}" -X POST --location $TRUSTY_ROUTE/metrics/identity/request \ --header 'Content-Type: application/json' \ --data "{ \"columnName\": \"$field\", \"batchSize\": 250, \"modelId\": \"$model\" }" echo -e done done
The payload structure is as follows:
-
columnName: The name of the field to compute the averaging over. -
batchSize: The number of previous inferences to include in the average-value calculation. -
modelId: The name of the model to query.
Verification
-
In the OpenShift Container Platform web console, click Observe → Metrics.
-
In the Expression field, enter
trustyai_identityand click Run Queries. -
Optional: After running a query, you can select a time range and refresh interval:
-
From the Time range list, select 5 minutes.
-
From the Refresh interval list, select 15 seconds.
-
Simulating real world data
Now that you have scheduled your fairness and identify metric requests, you can simulate sending some "real world" data through your models to see if they remain fair.
Procedure
-
In a terminal window, run the following command from the directory containing the downloaded tutorial files (
odh-trustyai-demos-main):for batch in "01" "02" "03" "04" "05" "06" "07" "08"; do ./2-BiasMonitoring/scripts/send_data_batch 2-BiasMonitoring/data/batch_$batch.json sleep 5 done
Verification
-
In the OpenShift Container Platform web console, click Observe → Metrics and watch the SPD and identity metric request values change.
Reviewing the results
Are the models biased?
The two models have drastically different fairness levels when applied to the simulated real-world data. Model Alpha (blue) stayed within the "acceptably fair" range between -0.1 and 0.1, ending around 0.09. However, Model Beta (yellow) plummeted out of the fair range, ending at -0.274. This indicates that non-male-identifying applicants were 27% less likely to receive a favorable outcome from Model Beta compared to male-identifying applicants.
To explore this further, you can analyze your identity metrics, starting by looking at the inbound ratio of male-identifying to non-male-identifying applicants:
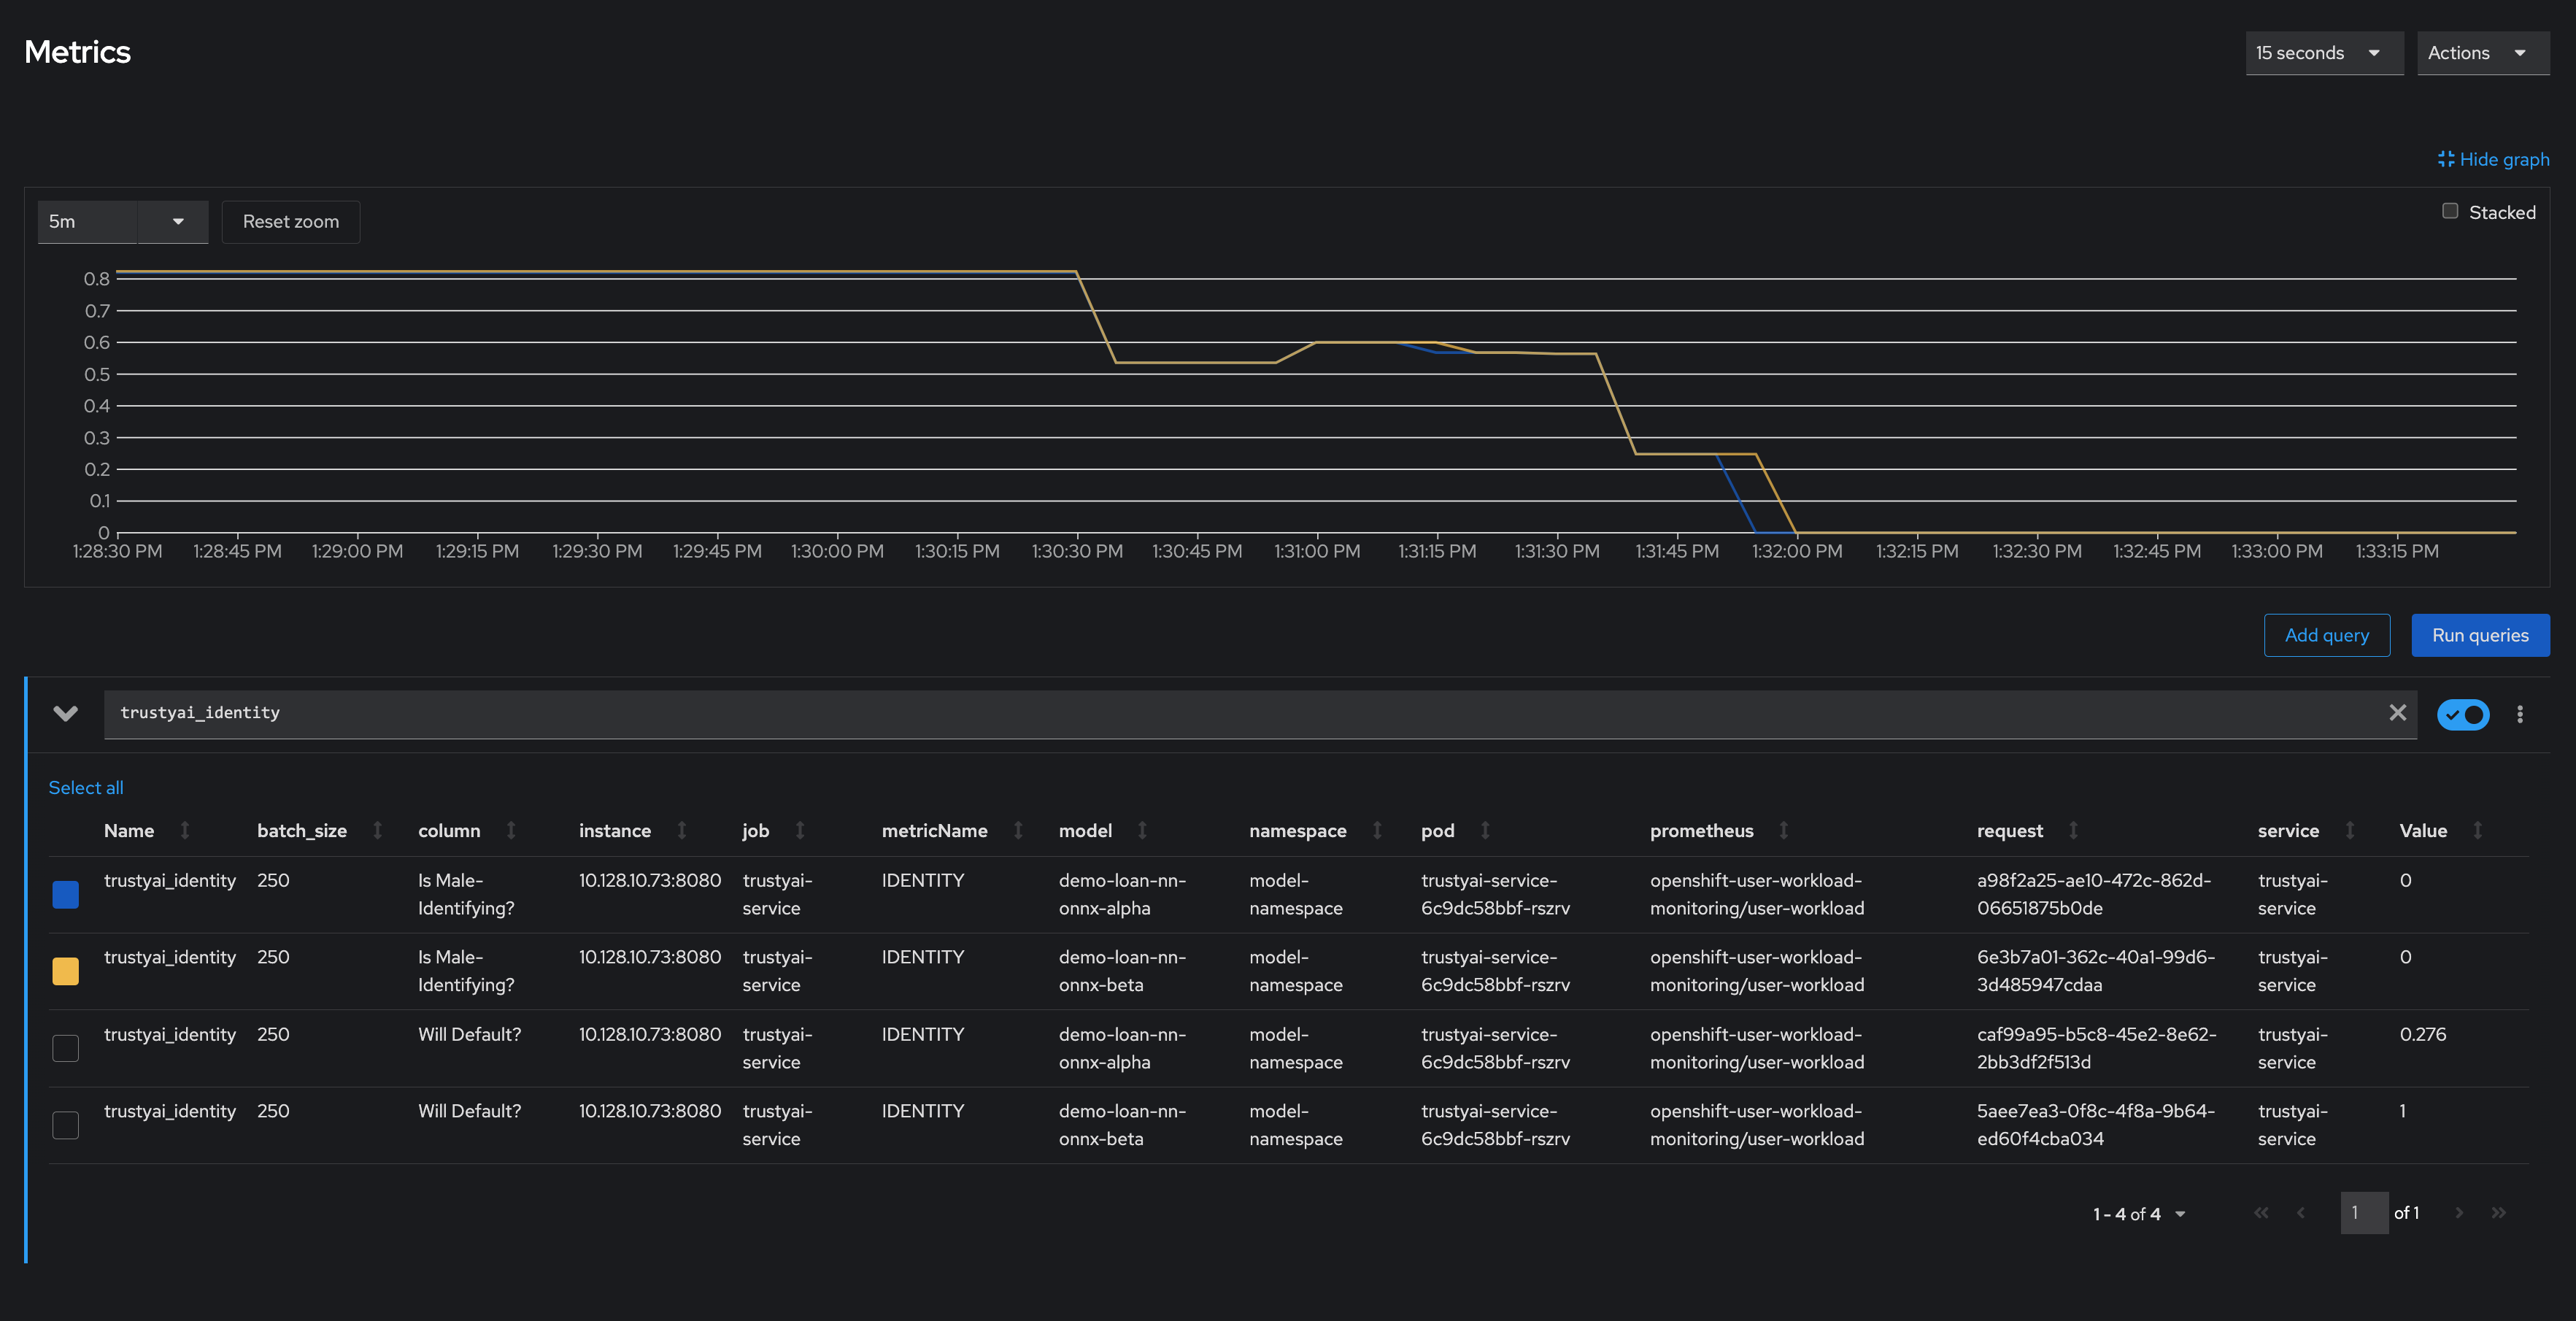
In the training data, the ratio between male and non-male was around 0.8, but in the real-world data, it dropped to 0, meaning all applicants were non-male. This is a strong indicator that the training data did not match the real-world data, which is likely to indicate poor or biased model performance.
How does the production data compare to the training data?
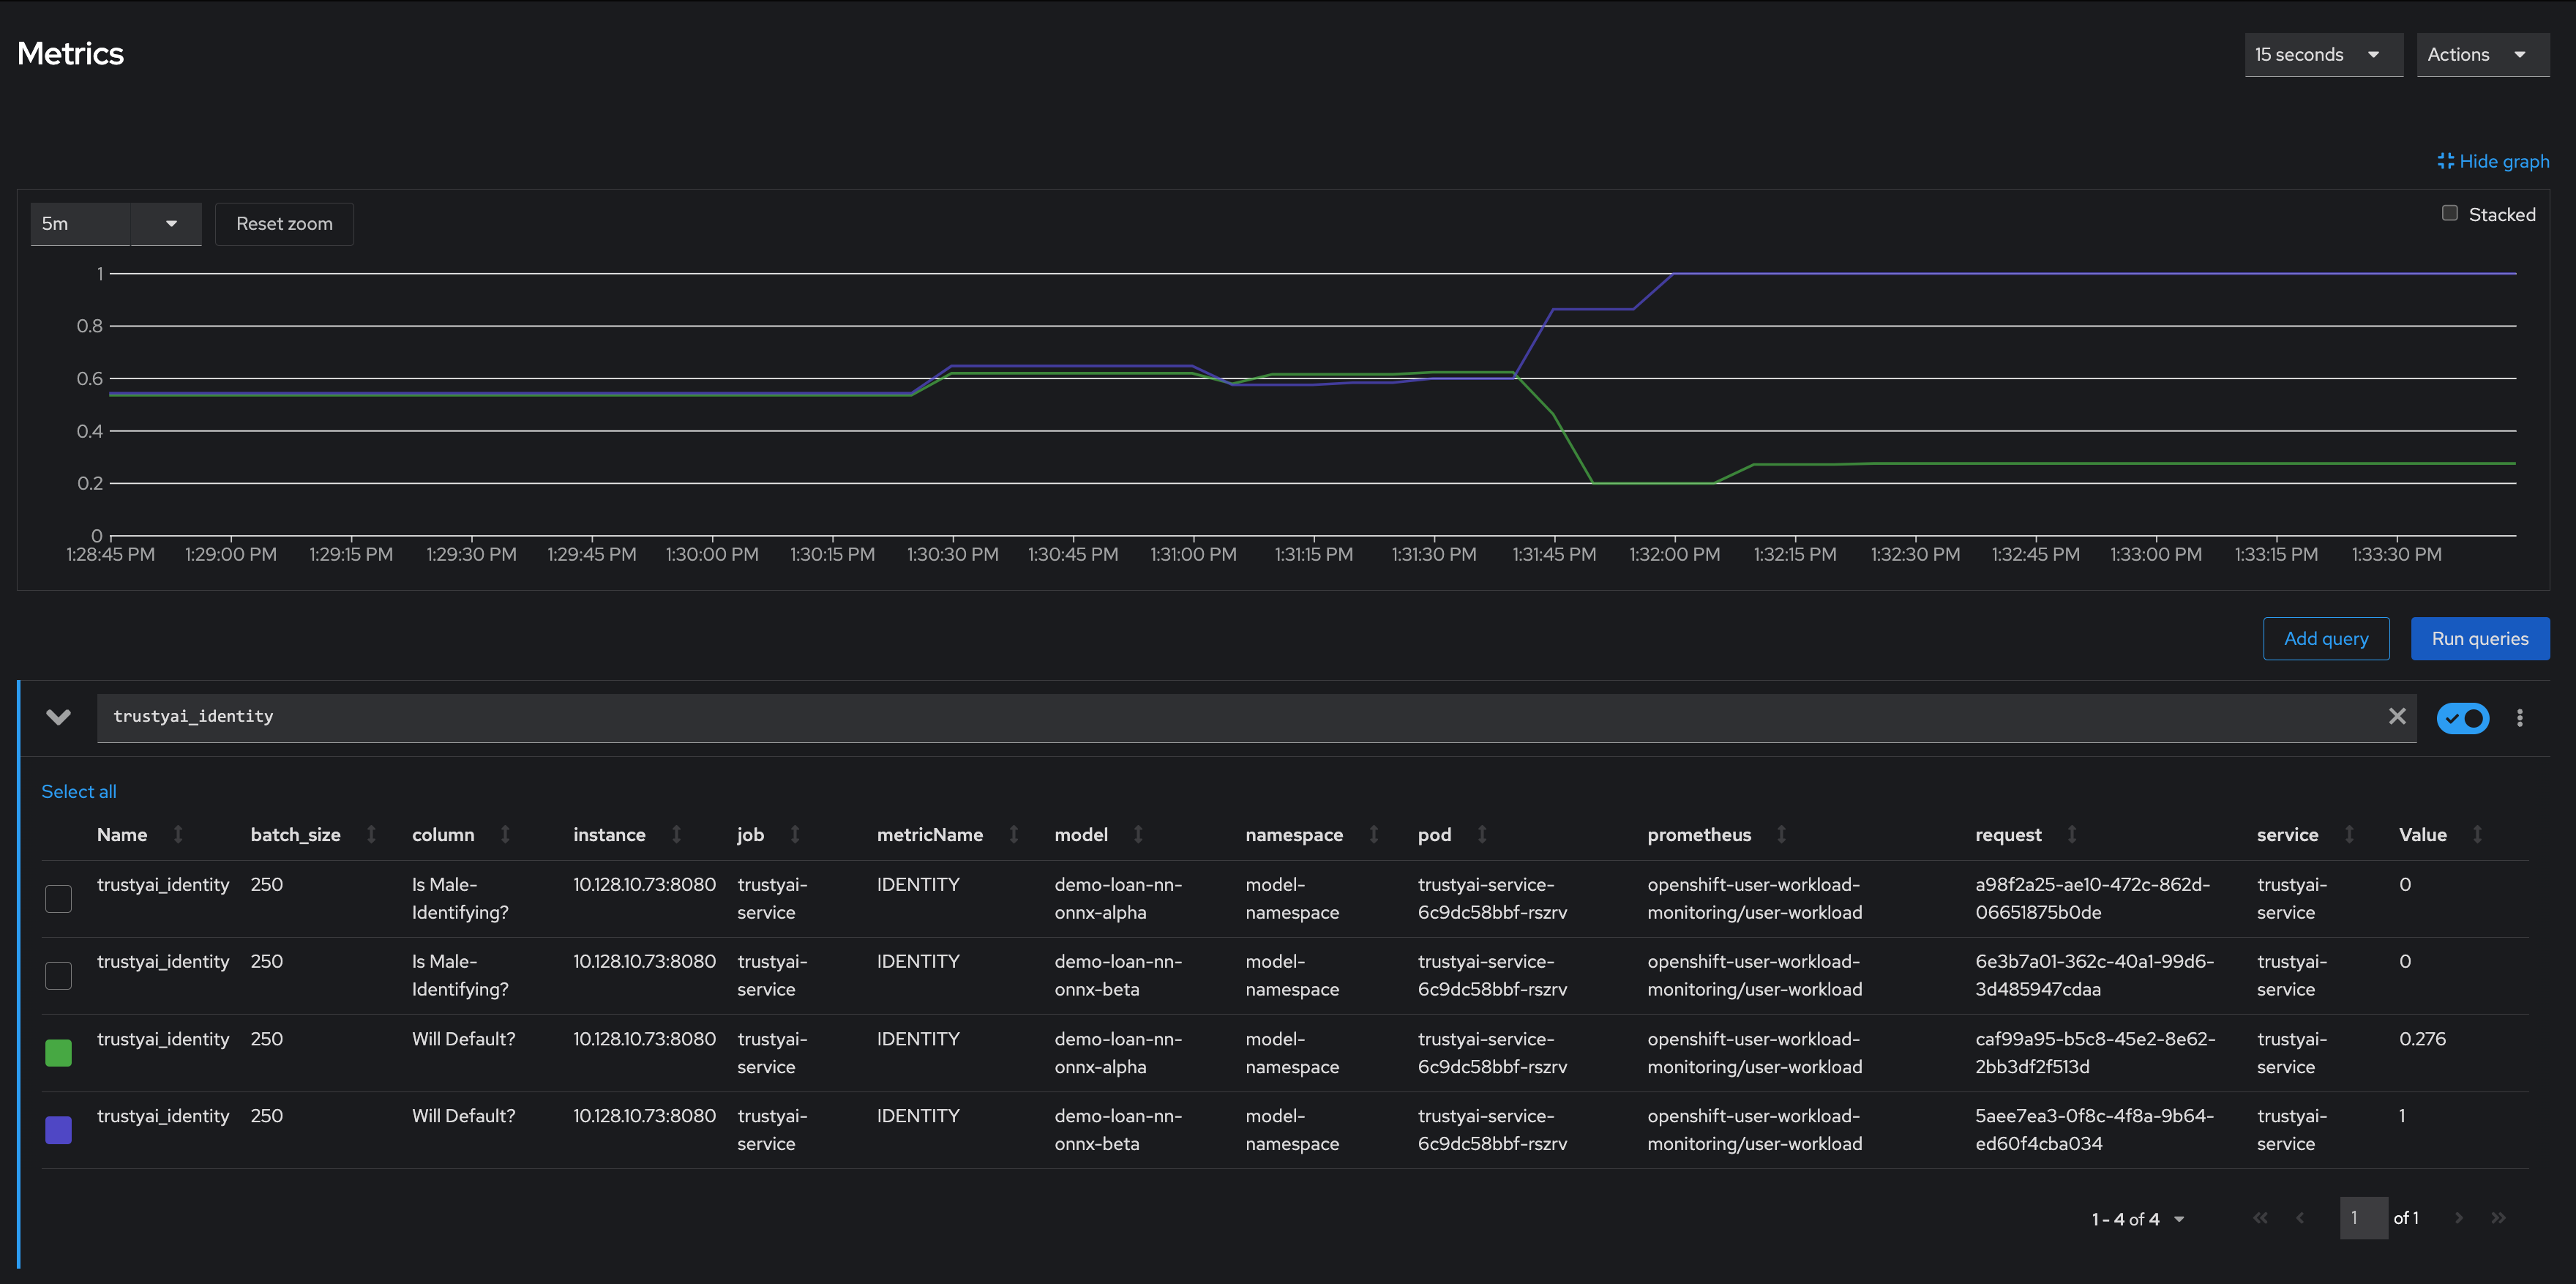
Even though Model Alpha (green) was only exposed to non-male applicants, it still provided varying outcomes to the various applicants, predicting "will-default" in about 25% of cases. In contrast, Model Beta (purple) predicted "will-default" 100% of the time, meaning it predicted that every non-male applicant would default on their loan. This suggests that Model Beta is performing poorly on the real-world data or has encoded a systematic bias from its training, leading to the assumption that all non-male applicants will default.
These examples highlight the critical importance of monitoring bias in production. Models that are equally fair during training can perform very differently when applied to real-world data, with hidden biases emerging only in actual use. By using TrustyAI to detect these biases early, you can safeguard against the potential harm caused by biased models in production.
Monitoring data drift
Data drift refers to changes that occur in the distribution of incoming data that differ significantly from the data on which the model was originally trained. This distributional shift can cause model performance to become unreliable, because machine learning models rely heavily on the patterns in their training data.
Detecting data drift helps ensure that your models continue to perform as expected and that they remain accurate and reliable. Trusty AI measures the statistical alignment between a model’s training data and its incoming inference data using specialized metrics.
Metrics for drift detection include:
-
Mean-Shift
-
FourierMMD
-
Kolmogorov-Smirnov
-
ApproxKSTest
Creating a drift metric
To monitor a deployed model for data drift, you must first create drift metrics.
For information about the specific data drift metrics, see Using drift metrics.
For the complete list of TrustyAI metrics, see TrustyAI service API.
Creating a drift metric by using the CLI
You can use the OpenShift CLI (oc) to create a data drift metric for a model.
Prerequisites
-
You are familiar with the specific data set schema and understand the relevant inputs and outputs.
-
Your OpenShift cluster administrator added you as a user to the OpenShift Container Platform cluster and has installed the TrustyAI service for the project that contains the deployed models.
-
You set up TrustyAI for your project, as described in Setting up TrustyAI for your project.
Procedure
-
Open a new terminal window.
-
Follow these steps to log in to your OpenShift Container Platform cluster:
-
In the upper-right corner of the OpenShift web console, click your user name and select Copy login command.
-
After you have logged in, click Display token.
-
Copy the Log in with this token command and paste it in the OpenShift CLI (
oc).$ oc login --token=<token> --server=<openshift_cluster_url>
-
-
Set the
TRUSTY_ROUTEvariable to the external route for the TrustyAI service pod.TRUSTY_ROUTE=https://$(oc get route/trustyai-service --template={{.spec.host}}) -
Optionally, get the full list of TrustyAI service endpoints and payloads.
curl -H "Authorization: Bearer $TOKEN" --location $TRUSTY_ROUTE/q/openapi
-
Use
POST /metrics/drift/meanshift/requestto schedule a recurring drift monitoring metric with the following syntax and payload structure:Syntax:
curl -k -H "Authorization: Bearer $TOKEN" -X POST --location $TRUSTY_ROUTE/metrics/drift/meanshift/request \
 --header 'Content-Type: application/json' \
 --data <payload>
Payload structure:
modelId-
The name of the model to monitor.
referenceTag-
The data to use as the reference distribution.
For example:
curl -k -H "Authorization: Bearer $TOKEN" -X POST --location $TRUSTY_ROUTE/metrics/drift/meanshift/request \
     --header 'Content-Type: application/json' \
     --data "{
                 \"modelId\": \"gaussian-credit-model\",
                 \"referenceTag\": \"TRAINING\"
             }"
Deleting a drift metric by using the CLI
You can use the OpenShift CLI (oc) to delete a drift metric for a model.
Prerequisites
-
You have installed the OpenShift CLI (
oc) as described in the appropriate documentation for your cluster:-
Installing the OpenShift CLI for OpenShift Container Platform
-
Installing the OpenShift CLI for Red Hat OpenShift Service on AWS
-
-
You have a user token for authentication as described in Authenticating the TrustyAI service.
-
There is an existing drift metric that you want to delete.
Procedure
-
Open a new terminal window.
-
Follow these steps to log in to your OpenShift Container Platform cluster:
-
In the OpenShift Container Platform web console, click your user name and select Copy login command.
-
After you have logged in, click Display token.
-
Copy the Log in with this token command and paste it in the OpenShift CLI (
oc).$ oc login --token=<token> --server=<openshift_cluster_url>
-
-
In the OpenShift CLI (
oc), get the route to the TrustyAI service:TRUSTY_ROUTE=https://$(oc get route/trustyai-service --template={{.spec.host}}) -
Optional: To list all currently active requests for a metric, use
GET /metrics/{{metric}}/requests. For example, to list all currently scheduled MeanShift metrics, type:curl -k -H "Authorization: Bearer $TOKEN" -X GET --location "$TRUSTY_ROUTE/metrics/drift/meanshift/requests"
Alternatively, to list all currently scheduled metric requests, use
GET /metrics/all/requests.curl -H "Authorization: Bearer $TOKEN" -X GET --location "$TRUSTY_ROUTE/metrics/all/requests"
-
To delete a metric, send an HTTP
DELETErequest to the/metrics/$METRIC/requestendpoint to stop the periodic calculation, including the id of periodic task that you want to cancel in the payload. For example:curl -k -H "Authorization: Bearer $TOKEN" -X DELETE --location "$TRUSTY_ROUTE/metrics/drift/meanshift/request" \ -H "Content-Type: application/json" \ -d "{ \"requestId\": \"$id\" }"
Verification
Use GET /metrics/{{metric}}/requests to list all currently active requests for the metric and verify the metric that you deleted is not shown. For example:
curl -H "Authorization: Bearer $TOKEN" -X GET --location "$TRUSTY_ROUTE/metrics/drift/meanshift/requests"
Viewing drift metrics for a model
After you create data drift monitoring metrics, use the OpenShift Container Platform web console to view and update the drift metrics that you configured.
Prerequisites
-
You have been assigned the
monitoring-rules-viewrole. For more information, see Granting users permission to configure monitoring for user-defined projects. -
You are familiar with how to monitor project metrics in the OpenShift Container Platform web console. For more information, see Monitoring your project metrics.
Procedure
-
Log in to the OpenShift Container Platform web console.
-
Switch to the Developer perspective.
-
In the left menu, click Observe.
-
As described in Monitoring your project metrics, use the web console to run queries for
trustyai_*metrics.
Using drift metrics
You can use the following data drift metrics in Open Data Hub:
- MeanShift
-
The MeanShift metric calculates the per-column probability that the data values in a test data set are from the same distribution as those in a training data set (assuming that the values are normally distributed). This metric measures the difference in the means of specific features between the two datasets.
MeanShift is useful for identifying straightforward changes in data distributions, such as when the entire distribution has shifted to the left or right along the feature axis.
This metric returns the probability that the distribution seen in the "real world" data is derived from the same distribution as the reference data. The closer the value is to 0, the more likely there is to be significant drift.
- FourierMMD
-
The FourierMMD metric provides the probability that the data values in a test data set have drifted from the training data set distribution, assuming that the computed Maximum Mean Discrepancy (MMD) values are normally distributed. This metric compares the empirical distributions of the data sets by using an MMD measure in the Fourier domain.
FourierMMD is useful for detecting subtle shifts in data distributions that might be overlooked by simpler statistical measures.
This metric returns the probability that the distribution seen in the "real world" data has drifted from the reference data. The closer the value is to 1, the more likely there is to be significant drift.
- KSTest
-
The KSTest metric calculates two Kolmogorov-Smirnov tests for each column to determine whether the data sets are derived from the same distributions. This metric measures the maximum distance between the empirical cumulative distribution functions (CDFs) of the data sets, without assuming any specific underlying distribution.
KSTest is useful for detecting changes in distribution shape, location, and scale.
This metric returns the probability that the distribution seen in the "real world" data is derived from the same distribution as the reference data. The closer the value is to 0, the more likely there is to be significant drift.
- ApproxKSTest
-
The ApproxKSTest metric performs an approximate Kolmogorov-Smirnov test, ensuring that the maximum error is
6*epsiloncompared to an exact KSTest.ApproxKSTest is useful for detecting changes in distributions for large data sets where performing an exact KSTest might be computationally expensive.
This metric returns the probability that the distribution seen in the "real world" data is derived from the same distribution as the reference data. The closer the value is to 0, the more likely there is to be significant drift.
Using a drift metric in a credit card scenario
This example scenario deploys an XGBoost model into your cluster and reviews its output using a drift metric.
The XGBoost model was created for the purpose of this demonstration and predicts credit card approval based on the following features: age, credit score, years of education, and years in employment.
When the model is deployed and the data that you upload is formatted, use the mean shift metric to monitor for data drift. This metric is useful for ensuring that a model remains accurate and reliable in a production environment.
Mean shift compares a numeric test dataset against a numeric training dataset. It produces a p-value that measures the probability the test data has originated from the same numeric distribution as the training data. A p-value less than 0.05 indicates a statistically significant drift between the two datasets. A p-value equal to or greater than 0.05 indicates no statistically significant evidence of drift.
|
Note
|
Mean shift performs best when each feature in the data is normally distributed. Choose a different metric for working with different or unknown data distributions. |
Prerequisites
-
Your cluster administrator added you as a user to the cluster and configured TrustyAI for use in the project that contains the deployed models.
-
You set up TrustyAI for your project, as described in Setting up TrustyAI for your project.
Procedure
-
Obtain a bearer token to authenticate your external endpoints by running the following command:
$ oc apply -f resources/service_account.yaml export TOKEN=$(oc create token user-one) -
In your model namespace, deploy the storage container, serving runtime, and the credit model:
$ oc project model-namespace || true $ oc apply -f resources/model_storage_container.yaml $ oc apply -f resources/odh-mlserver-1.x.yaml $ oc apply -f resources/model_gaussian_credit.yaml -
Set the route for your data upload:
TRUSTY_ROUTE=https://$(oc get route/trustyai-service --template={{.spec.host}}) -
Download the training data payload (file size 472 KB):
wget https://github.com/trustyai-explainability/odh-trustyai-demos/blob/72f748da9410f92a60bea73ce5e3f47c10ad1cea/3-DataDrift/kserve-demo/data/training_data.json -O training_data.json -
Label your model training data. This data has four main fields. The
model_nameanddata_tagfields require a label because they are directly referenced in the Metrics dashboard later in the scenario. In addition to the required fields, it is best to also label response and request fields. The four fields are:-
model_name: The name of the model that correlates to this data. The name should match that of the model provided in the model YAML, which isgaussian-credit-model. -
data_tag: A string tag to reference this particular set of data. Use the string"TRAINING". -
request: This is a KServe inference request, as if you were sending this data directly to the model server’s/inferendpoint. -
response: The KServe inference response that is returned from sending the above request to the model.
-
-
Upload the model training data to the TrustyAI endpoint:
curl -sk -H "Authorization: Bearer ${TOKEN}" $TRUSTY_ROUTE/data/upload  \
 --header 'Content-Type: application/json' \
 -d @training_data.json
The following message appears confirming the data upload:
1000 datapoints successfully added to gaussian-credit-model data. -
Label your model input and output fields with the actual column names of the data in your KServe payloads. Send a JSON payload containing a simple set of
original-name:new-name pairs, assigning new meaningful names to the input and output features of your model. A message that says "Feature and output name mapping successfully applied" appears if the request is successful:curl -sk -H "Authorization: Bearer ${TOKEN}" -X POST --location $TRUSTY_ROUTE/info/names \ -H "Content-Type: application/json" \ -d "{ \"modelId\": \"gaussian-credit-model\", \"inputMapping\": { \"credit_inputs-0\": \"Age\", \"credit_inputs-1\": \"Credit Score\", \"credit_inputs-2\": \"Years of Education\", \"credit_inputs-3\": \"Years of Employment\" }, \"outputMapping\": { \"predict-0\": \"Acceptance Probability\" } }"TipDefine name mappings in TrustyAI to assign memorable names to input or output names. These names can then be used in subsequent requests to the TrustyAI service.
-
Verify that TrustyAI has received the data by querying the
/infoendpoint:curl -H "Authorization: Bearer ${TOKEN}" $TRUSTY_ROUTE/info | jq '.["gaussian-credit-model"].data.inputSchema' -
The following output appears as a JSON file confirming that TrustyAI has successfully received the data:
{ "items": { "Years of Education": { "type": "DOUBLE", "name": "credit_inputs-2", "columnIndex": 2 }, "Years of Employment": { "type": "DOUBLE", "name": "credit_inputs-3", "columnIndex": 3 }, "Age": { "type": "DOUBLE", "name": "credit_inputs-0", "columnIndex": 0 }, "Credit Score": { "type": "DOUBLE", "name": "credit_inputs-1", "columnIndex": 1 } }, "nameMapping": { "credit_inputs-0": "Age", "credit_inputs-1": "Credit Score", "credit_inputs-2": "Years of Education", "credit_inputs-3": "Years of Employment" } } -
Create a recurring drift monitoring metric using
/metrics/drift/meanshift/request. This will measure the drift of all recorded inference data against the reference distribution. The body of the payload requires amodelIdthat sets which model to monitor and a referenceTag that determines which data to use as the reference distribution. The values of these fields should match themodelIdandreferenceTaginside your data upload payload:curl -k -H "Authorization: Bearer ${TOKEN}" -X POST --location $TRUSTY_ROUTE/metrics/drift/meanshift/request -H "Content-Type: application/json" \ -d "{ \"modelId\": \"gaussian-credit-model\", \"referenceTag\": \"TRAINING\" }" -
Check the metrics in the OpenShift console under Observe → Metrics:
-
Set the time window to 5 minutes and the refresh interval to 15 seconds.
-
In the Expression field, enter
trustyai_meanshift.NoteIt may take a few seconds before the cluster monitoring stacks picks up the new metric. You may need to refresh before the new metrics appear, if you’re already in the section of the OpenShift console.
-
-
Observe in the Metric Chart onscreen that a metric is emitted for each of the four features and the single output, making for five measurements in total. All metric values should equal 1 (no drift), because we only have the training data, which can’t drift from itself.
-
Collect some simulated real-world inferences to observe the drift monitoring. To do this, send small batches of data to the model, mimicking a real-world deployment:
-
Get the route to the model:
MODEL=gaussian-credit-model BASE_ROUTE=$(oc get inferenceservice gaussian-credit-model -o jsonpath='{.status.url}') MODEL_ROUTE="${BASE_ROUTE}/v2/models/${MODEL}/infer" -
Download the data batch and send data payloads to your model:
DATA_PATH=sample_trustyai_model_data
mkdir $DATA_PATH
for batch in {0..595..5}; do
	wget https://github.com/trustyai-explainability/odh-trustyai-demos/blob/72f748da9410f92a60bea73ce5e3f47c10ad1cea/3-DataDrift/kserve-demo/data/data_batches/$batch.json -O $DATA_PATH/$batch.json
	curl -sk "${MODEL_ROUTE}"\
  		-H "Authorization: Bearer ${TOKEN}" \
  		-H "Content-Type: application/json" \
  		-d @$DATA_PATH/$batch.json
  	sleep 1
done
-
-
Observe the updated drift metrics in the Observe → Metrics section of the OpenShift console. The mean shift metric values for the various features change:
-
The values for Credit Score, Age, and Acceptance Probability have all dropped to 0, indicating there is a statistically very high likelihood that the values of these fields in the inference data come from a different distribution than that of the training data.
-
The Years of Employment and Years of Education scores have dropped to 0.34 and 0.82 respectively, indicating that there is a little drift, but not enough to be particularly concerning.
-
Using explainability
Learn about how your machine learning model makes its predictions and decisions using explainers from TrustyAI to provide saliency explanations for model inferences in Open Data Hub.
For information about the specific explainers, see Using explainers.
Requesting a LIME explanation
To understand how a model makes its predictions and decisions, you can use a Local Interpretable Model-agnostic Explanations (LIME) explainer. LIME explains a model’s predictions by showing how much each feature affected the outcome. For example, for a model predicting not to target a user for a marketing campaign, LIME provides a list of weights, both positive and negative, indicating how each feature influenced the model’s outcome.
For more information, see Using explainers.
Requesting a LIME explanation by using the CLI
You can use the OpenShift CLI (oc) to request a LIME explanation.
Prerequisites
-
Your OpenShift cluster administrator added you as a user to the OpenShift Container Platform cluster and has installed the TrustyAI service for the project that contains the deployed models.
-
You authenticated the TrustyAI service, as described in Authenticating the TrustyAI service.
-
You have real-world data from the deployed models.
-
You have installed the OpenShift CLI (
oc) as described in the appropriate documentation for your cluster:-
Installing the OpenShift CLI for OpenShift Container Platform
-
Installing the OpenShift CLI for Red Hat OpenShift Service on AWS
-
Procedure
-
Open a new terminal window.
-
Follow these steps to log in to your OpenShift Container Platform cluster:
-
In the upper-right corner of the OpenShift web console, click your user name and select Copy login command.
-
After you have logged in, click Display token.
-
Copy the Log in with this token command and paste it in the OpenShift CLI (
oc).$ oc login --token=<token> --server=<openshift_cluster_url>
-
-
Set an environment variable to define the external route for the TrustyAI service pod.
export TRUSTY_ROUTE=$(oc get route trustyai-service -n $NAMESPACE -o jsonpath='{.spec.host}') -
Set an environment variable to define the name of your model.
export MODEL="model-name"
-
Use
GET /info/inference/ids/${MODEL}to get a list of all inference IDs within your model inference data set.curl -skv -H "Authorization: Bearer ${TOKEN}" \ https://${TRUSTY_ROUTE}/info/inference/ids/${MODEL}?type=organicYou see output similar to the following:
[ { "id":"a3d3d4a2-93f6-4a23-aedb-051416ecf84f", "timestamp":"2024-06-25T09:06:28.75701201" } ] -
Set environment variables to define the two latest inference IDs (highest and lowest predictions).
export ID_LOWEST=$(curl -s ${TRUSTY_ROUTE}/info/inference/ids/${MODEL}?type=organic | jq -r '.[-1].id') export ID_HIGHEST=$(curl -s ${TRUSTY_ROUTE}/info/inference/ids/${MODEL}?type=organic | jq -r '.[-2].id') -
Use
POST /explainers/local/limeto request the LIME explanation with the following syntax and payload structure:Syntax:
curl -sk -H "Authorization: Bearer ${TOKEN}" -X POST \
 -H "Content-Type: application/json" \
 -d <payload>
Payload structure:
PredictionId-
The inference ID.
config-
The configuration for the LIME explanation, including
modelandexplainerparameters. For more information, see Model configuration parameters and LIME explainer configuration parameters.
For example:
echo "Requesting LIME for lowest"
curl -s -H "Authorization: Bearer ${TOKEN}" -X POST \
    -H "Content-Type: application/json" \
    -d "{
        \"predictionId\": \"$ID_LOWEST\",
        \"config\": {
            \"model\": { (1)
                \"target\": \"modelmesh-serving:8033\", (2)
                \"name\": \"${MODEL}\",
                \"version\": \"v1\"
            },
            \"explainer\": { (3)
              \"n_samples\": 50,
              \"normalize_weights\": \"false\",
              \"feature_selection\": \"false\"
            }
        }
    }" \
    ${TRUSTYAI_ROUTE}/explainers/local/lime
echo "Requesting LIME for highest"
curl -sk -H "Authorization: Bearer ${TOKEN}" -X POST \
-H "Content-Type: application/json" \
-d "{
\"predictionId\": \"$ID_HIGHEST\",
\"config\": {
\"model\": { (1)
\"target\": \"modelmesh-serving:8033\", (2)
\"name\": \"${MODEL}\",
\"version\": \"v1\"
},
\"explainer\": { (3)
\"n_samples\": 50,
\"normalize_weights\": \"false\",
\"feature_selection\": \"false\"
}
}
}" \
${TRUSTYAI_ROUTE}/explainers/local/lime-
Specifies configuration for the model. For more information about the model configuration options, see Model configuration parameters.
-
Specifies the model server service URL. This field only accepts model servers in the same namespace as the TrustyAI service, with or without protocol or port number.
-
http[s]://service[:port] -
service[:port]
-
-
Specifies the configuration for the explainer. For more information about the explainer configuration parameters, see LIME explainer configuration parameters.
Requesting a SHAP explanation
To understand how a model makes its predictions and decisions, you can use a SHapley Additive exPlanations (SHAP) explainer. SHAP explains a model’s prediction by showing a detailed breakdown of each feature’s contribution to the final outcome. For example, for a model predicting the price of a house, SHAP provides a list of how much each feature contributed (in monetary value) to the final price.
For more information, see Using explainers.
Requesting a SHAP explanation by using the CLI
You can use the OpenShift CLI (oc) to request a SHAP explanation.
Prerequisites
-
Your OpenShift cluster administrator added you as a user to the OpenShift Container Platform cluster and has installed the TrustyAI service for the project that contains the deployed models.
-
You authenticated the TrustyAI service, as described in Authenticating the TrustyAI service.
-
You have real-world data from the deployed models.
-
You have installed the OpenShift CLI (
oc) as described in the appropriate documentation for your cluster:-
Installing the OpenShift CLI for OpenShift Container Platform
-
Installing the OpenShift CLI for Red Hat OpenShift Service on AWS
-
Procedure
-
Open a new terminal window.
-
Follow these steps to log in to your OpenShift Container Platform cluster:
-
In the upper-right corner of the OpenShift web console, click your user name and select Copy login command.
-
After you have logged in, click Display token.
-
Copy the Log in with this token command and paste it in the OpenShift CLI (
oc).$ oc login --token=<token> --server=<openshift_cluster_url>
-
-
Set an environment variable to define the external route for the TrustyAI service pod.
export TRUSTY_ROUTE=$(oc get route trustyai-service -n $NAMESPACE -o jsonpath='{.spec.host}') -
Set an environment variable to define the name of your model.
export MODEL="model-name"
-
Use
GET /info/inference/ids/${MODEL}to get a list of all inference IDs within your model inference data set.curl -skv -H "Authorization: Bearer ${TOKEN}" \ https://${TRUSTY_ROUTE}/info/inference/ids/${MODEL}?type=organicYou see output similar to the following:
[ { "id":"a3d3d4a2-93f6-4a23-aedb-051416ecf84f", "timestamp":"2024-06-25T09:06:28.75701201" } ] -
Set environment variables to define the two latest inference IDs (highest and lowest predictions).
export ID_LOWEST=$(curl -s ${TRUSTY_ROUTE}/info/inference/ids/${MODEL}?type=organic | jq -r '.[-1].id') export ID_HIGHEST=$(curl -s ${TRUSTY_ROUTE}/info/inference/ids/${MODEL}?type=organic | jq -r '.[-2].id') -
Use
POST /explainers/local/shapto request the SHAP explanation with the following syntax and payload structure:Syntax:
curl -sk -H "Authorization: Bearer ${TOKEN}" -X POST \
 -H "Content-Type: application/json" \
 -d <payload>
Payload structure:
PredictionId-
The inference ID.
config-
The configuration for the SHAP explanation, including
modelandexplainerparameters. For more information, see Model configuration parameters and SHAP explainer configuration parameters.
For example:
echo "Requesting SHAP for lowest"
curl -sk -H "Authorization: Bearer ${TOKEN}" -X POST \
  -H "Content-Type: application/json" \
  -d "{
    \"predictionId\": \"$ID_LOWEST\",
    \"config\": {
        \"model\": { (1)
            \"target\": \"modelmesh-serving:8033\", (2)
            \"name\": \"${MODEL}\",
            \"version\": \"v1\"
        },
        \"explainer\": { (3)
          \"n_samples\": 75
        }
    }
  }" \
  ${TRUSTYAI_ROUTE}/explainers/local/shap
echo "Requesting SHAP for highest"
curl -sk -H "Authorization: Bearer ${TOKEN}" -X POST \
-H "Content-Type: application/json" \
-d "{
\"predictionId\": \"$ID_HIGHEST\",
\"config\": {
\"model\": { (1)
\"target\": \"modelmesh-serving:8033\", (2)
\"name\": \"${MODEL}\",
\"version\": \"v1\"
},
\"explainer\": { (3)
\"n_samples\": 75
}
}
}" \
${TRUSTYAI_ROUTE}/explainers/local/shap-
Specifies configuration for the model. For more information about the model configuration options, see Model configuration parameters.
-
Specifies the model server service URL. This field only accepts model servers in the same namespace as the TrustyAI service, with or without protocol or port number.
-
http[s]://service[:port] -
service[:port]
-
-
Specifies the configuration for the explainer. For more information about the explainer configuration parameters, see SHAP explainer configuration parameters.
Using explainers
You can use the following explainers in Open Data Hub:
LIME
Local Interpretable Model-agnostic Explanations (LIME) [1] is a saliency explanation method. LIME aims to explain a prediction 𝑝 = (𝑥, 𝑦) (an input-output pair) generated by a black-box model 𝑓 : ℝ𝑑 → ℝ. The explanations come in the form of a "saliency" 𝑤𝑖 attached to each feature 𝑥𝑖 in the prediction 𝑥. LIME generates a local explanation ξ(𝑥) according to the following model:
-
𝜋𝑥 is a proximity function
-
𝐺 is the family of interpretable models
-
Ω(𝑔) is a measure of complexity of an explanation 𝑔 ∈ 𝐺
-
𝐿(𝑓, 𝑔, 𝜋𝑥) is a measure of how unfaithful 𝑔 is in approximating 𝑓 in the locality defined by 𝜋𝑥
In the original paper, 𝐺 is the class of linear models and 𝜋𝑥 is an exponential kernel on a distance function 𝐷 (for example, cosine distance). LIME converts samples 𝑥𝑖 from the original domain into interpretable samples as binary vectors 𝑥′𝑖 ∈ 0,1. An encoded data set 𝐸 is built by taking nonzero elements of 𝑥′𝑖 , recovering the original representation 𝑧 ∈ ℝ𝑑 and then computing 𝑓(𝑧). A weighted linear model 𝑔 (with weights provided via 𝜋𝑥) is then trained on the generated sparse data set 𝐸 and the model weights 𝑤 are used as feature weights for the final explanation ξ(𝑥).
SHAP
SHapley Additive exPlanations (SHAP), [2] seeks to unify several common explanation methods, notably LIME [1] and DeepLIFT, [3] under a common umbrella of additive feature attributions. These methods explain how an input 𝑥 = [𝑥1, 𝑥2, …, 𝑥𝑀] affects the output of some model 𝑓 by transforming 𝑥 ∈ ℝ𝑀 into simplified inputs 𝑧′ ∈ 0, 1𝑀 , such that 𝑧′𝑖 indicates the inclusion or exclusion of feature 𝑖. The simplified inputs are then passed to an explanatory model 𝑔 that takes the following form:
In that form, each value 𝛷𝑖 marks the contribution that feature 𝑖 had on the output model (called the attribution), 𝛷0 marks the null output of the model; the model output when every feature is excluded. Therefore, this presents an easily interpretable explanation of the importance of each feature and a framework to permute the various input features to establish their collection contributions.
The final result of the algorithm are the Shapley values of each feature, which give an itemized "receipt" of all the contributing factors to the decision. For example, a SHAP explanation of a loan application might be as follows:
| Feature | Shapley Value φ |
|---|---|
Null Output |
50% |
Income |
+10% |
# Children |
-15% |
Age |
+22% |
Own Home? |
-30% |
Acceptance% |
37% |
Deny |
63% |
From this, the applicant can see that the biggest contributor to their denial was their home ownership status, which reduced their acceptance probability by 30 percentage points. Meanwhile, their number of children was of particular benefit, increasing their probability by 22 percentage points.
1. Marco Tulio Ribeiro, Sameer Singh, Carlos Guestrin. "Why Should I Trust You?": Explaining the Predictions of Any Classifier." Proceedings of the 22nd ACM SIGKDD International Conference on Knowledge Discovery and Data mining, 2016. Pages 1135-1144.
2. Scott Lundberg, Su-In Lee. "A Unified Approach to Interpreting Model Predictions." Advances in Neural Information Processing Systems, 2017.
3. Avanti Shrikumar, Peyton Greenside, Anshul Kundaje. "Learning Important Features Through Propagating Activation Differences." CoRR abs/1704.02685, 2017.