
 trustyai:
    managementState: Managed
Info alert:Important Notice
Please note that more information about the previous v2 releases can be found here. You can use "Find a release" search bar to search for a particular release.
Monitoring data science models
Table of Contents
Overview of model monitoring
To ensure that machine learning models are transparent, fair, and reliable, data scientists can use TrustyAI in Open Data Hub to monitor and assess their data science models.
Data scientists can monitor their data science and machine learning models in Open Data Hub for the following metrics:
-
Bias: Check for unfair patterns or biases in data and model predictions to ensure your model’s decisions are unbiased.
-
Data drift: Detect changes in input data distributions over time by comparing the latest real-world data to the original training data. Comparing the data identifies shifts or deviations that could impact model performance, ensuring that the model remains accurate and reliable.
-
Explainability: Understand how your model makes predictions and decisions.
Data scientists can assess their data science and machine learning models in Open Data Hub using the following services:
-
LLM evaluation: Monitor your Large Language Models (LLMs) against a range of metrics, in order to ensure the accuracy and quality of its output.
-
Guardrails: Safeguard text generation inputs and outputs of Large Language Models (LLMs). The Guardrails Orchestrator manages the network requests between the user, the generative model, and the various detector services, and the Guardrails detectors identify and flag content that violates predefined rules, such as the presence of sensitive data, harmful language, or prompt injection attacks, as well as perform standalone detections.
Configuring TrustyAI
To configure model monitoring with TrustyAI to use in Open Data Hub, a cluster administrator does the following tasks:
-
Configure monitoring for the model serving platform
-
Enable the TrustyAI component in the Open Data Hub Operator
-
Configure TrustyAI to use a database, if you want to use your database instead of a PVC for storage with TrustyAI
-
Install the TrustyAI service on each project that contains models that the data scientists want to monitor
-
(Optional) Configure TrustyAI and KServe RawDeployment (standard deployment mode) integration
Configuring monitoring for your model serving platform
For deploying large models such as large language models (LLMs), use the model serving platform.
+ To configure monitoring for this platform, see Configuring monitoring for the model serving platform.
Enabling the TrustyAI component
To allow your data scientists to use model monitoring with TrustyAI, you must enable the TrustyAI component in Open Data Hub.
Prerequisites
-
You have cluster administrator privileges for your OpenShift Container Platform cluster.
-
You have access to the data science cluster.
-
You have installed Open Data Hub.
Procedure
-
In the OpenShift Container Platform console, click Operators → Installed Operators.
-
Search for the Open Data Hub Operator, and then click the Operator name to open the Operator details page.
-
Click the Data Science Cluster tab.
-
Click the default instance name (for example, default-dsc) to open the instance details page.
-
Click the YAML tab to show the instance specifications.
-
In the
spec:componentssection, set themanagementStatefield for thetrustyaicomponent toManaged: -
Click Save.
Verification
Check the status of the trustyai-service-operator pod:
-
In the OpenShift Container Platform console, from the Project list, select opendatahub.
-
Click Workloads → Deployments.
-
Search for the trustyai-service-operator-controller-manager deployment. Check the status:
-
Click the deployment name to open the deployment details page.
-
Click the Pods tab.
-
View the pod status.
When the status of the trustyai-service-operator-controller-manager-<pod-id> pod is Running, the pod is ready to use.
-
Configuring TrustyAI with a database
If you have a relational database in your OpenShift Container Platform cluster such as MySQL or MariaDB, you can configure TrustyAI to use your database instead of a persistent volume claim (PVC). Using a database instead of a PVC for storage can improve scalability, performance, and data management in TrustyAI. Provide TrustyAI with a database configuration secret before deployment. You can create a secret or specify the name of an existing Kubernetes secret within your project.
Prerequisites
-
You have cluster administrator privileges for your OpenShift Container Platform cluster.
-
You have installed the OpenShift CLI (
oc) as described in the appropriate documentation for your cluster:-
Installing the OpenShift CLI for OpenShift Container Platform
-
Installing the OpenShift CLI for Red Hat OpenShift Service on AWS
-
-
You have enabled the TrustyAI component, as described in Enabling the TrustyAI component.
-
The data scientist has created a project, as described in Creating a project, that contains the models that the data scientist wants to monitor.
-
If you are configuring the TrustyAI service with an external MySQL database, your database must already be in your cluster and use at least MySQL version 5.x. However, Red Hat recommends that you use MySQL version 8.x.
-
If you are configuring the TrustyAI service with a MariaDB database, your database must already be in your cluster and use MariaDB version 10.3 or later. However, Red Hat recommends that you use at least MariaDB version 10.5.
|
Note
|
The transport security layer (TLS) protocol does not work with the MariaDB operator 0.29 or later versions. The MariaDB operator for |
Procedure
-
In a terminal window, if you are not already logged in to your OpenShift cluster as a cluster administrator, log in to the OpenShift CLI (
oc) as shown in the following example:$ oc login <openshift_cluster_url> -u <admin_username> -p <password> -
Optional: If you want to use a TLS connection between TrustyAI and the database, create a TrustyAI service database TLS secret that uses the same certificates that you want to use for the database.
-
Create a YAML file to contain your TLS secret and add the following code:
apiVersion: v1 kind: Secret metadata: name: <service_name>-db-tls type: kubernetes.io/tls data: tls.crt: | <TLS CERTIFICATE> tls.key: | <TLS KEY> -
Save the file with the file name <service_name>-db-tls.yaml. For example, if your service name is
trustyai-service, save the file as trustyai-service-db-tls.yaml. -
Apply the YAML file in the project that contains the models that the data scientist wants to monitor:
$ oc apply -f <service_name>-db-tls.yaml -n <project_name>
-
-
Create a secret (or specify an existing one) that has your database credentials.
-
Create a YAML file to contain your secret and add the following code:
apiVersion: v1 kind: Secret metadata: name: db-credentials type: Opaque stringData: databaseKind: <mariadb> (1) databaseUsername: <TrustyAI_username> (2) databasePassword: <TrustyAI_password> (3) databaseService: mariadb-service (4) databasePort: 3306 (5) databaseGeneration: update (6) databaseName: trustyai_service (7)-
The only currently supported
databaseKindvalue ismariadb. -
The username you want TrustyAI to use when interfacing with the database.
-
The password that TrustyAI must use when connecting to the database.
-
The Kubernetes (K8s) service that TrustyAI must use when connecting to the database (the default
mariadb) . -
The port that TrustyAI must use when connecting to the database (default is 3306).
-
The database schema generation strategy to be used by TrustyAI. It is the setting for the
quarkus.hibernate-orm.database.generationargument, which determines how TrustyAI interacts with the database on its initial connection. Set tonone,create,drop-and-create,drop,update, orvalidate. -
The name of the individual database within the database service that the username and password authenticate to, as well as the specific database name that TrustyAI should read and write to on the database server.
-
-
Save the file with the file name db-credentials.yaml. You will need this name later when you install or change the TrustyAI service.
-
Apply the YAML file in the project that contains the models that the data scientist wants to monitor:
$ oc apply -f db-credentials.yaml -n <project_name>
-
-
If you are installing TrustyAI for the first time on a project, continue to Installing the TrustyAI service for a project.
If you already installed TrustyAI on a project, you can migrate the existing TrustyAI service from using a PVC to using a database.
-
Create a YAML file to update the TrustyAI service custom resource (CR) and add the following code:
apiVersion: trustyai.opendatahub.io/v1 kind: TrustyAIService metadata: annotations: trustyai.opendatahub.io/db-migration: "true" (1) name: trustyai-service (2) spec: storage: format: "DATABASE" (3) folder: "/inputs" (4) size: "1Gi" (5) databaseConfigurations: <database_secret_credentials> (6) data: filename: "data.csv" (7) metrics: schedule: "5s" (8)-
Set to
trueto prompt the migration from PVC to database storage. -
The name of the TrustyAI service instance.
-
The storage format for the data. Set this field to
DATABASE. -
The location within the PVC where you were storing the data. This must match the value specified in the existing CR.
-
The size of the data to request.
-
The name of the secret with your database credentials that you created in an earlier step. For example,
db-credentials. -
The suffix for the existing stored data files. This must match the value specified in the existing CR.
-
The interval at which to calculate the metrics. The default is
5s. The duration is specified with the ISO-8601 format. For example,5sfor 5 seconds,5mfor 5 minutes, and5hfor 5 hours.
-
-
Save the file. For example, trustyai_crd.yaml.
-
Apply the new TrustyAI service CR to the project that contains the models that the data scientist wants to monitor:
$ oc apply -f trustyai_crd.yaml -n <project_name>
-
Installing the TrustyAI service for a project
Install the TrustyAI service on a project to provide access to its features for all models deployed within that project. An instance of the TrustyAI service is required for each project, or namespace, that contains models that the data scientists want to monitor.
Use the Open Data Hub dashboard or the OpenShift CLI (oc) to install an instance of the TrustyAI service.
|
Note
|
Install only one instance of the TrustyAI service in a project. Multiple instances in the same project can result in unexpected behavior. Installing TrustyAI into a namespace where non-OVMS models are deployed can cause errors in the TrustyAI service. |
Installing the TrustyAI service by using the dashboard
You can use the Open Data Hub dashboard to install an instance of the TrustyAI service.
Prerequisites
-
A cluster administrator has configured monitoring for the model serving platform, as described in Configuring monitoring for the multi-model serving platform.
-
A cluster administrator has enabled the TrustyAI component, as described in Enabling the TrustyAI component.
-
If you are using TrustyAI with a database instead of PVC, a cluster administrator has configured TrustyAI to use the database, as described in Configuring TrustyAI with a database.
-
The data scientist has created a project, as described in Creating a project, that contains the models that the data scientist wants to monitor.
-
You have logged in to Open Data Hub as a user with Open Data Hub administrator privileges.
Procedure
-
From the Open Data Hub dashboard, click Projects.
The Projects page opens.
-
Click the name of the project that contains the models that the data scientist wants to monitor.
The project details page opens.
-
Click the Settings tab.
-
Select the Enable model bias monitoring checkbox.
Verification
-
In the OpenShift Container Platform web console, click Workloads → Pods.
-
From the project list, select the project in which you installed TrustyAI.
-
Confirm that the Pods list includes a running pod for the TrustyAI service. The pod has a naming pattern similar to the following example:
trustyai-service-5d45b5884f-96h5z
Installing the TrustyAI service by using the CLI
You can use the OpenShift CLI (oc) to install an instance of the TrustyAI service.
Prerequisites
-
You have cluster administrator privileges for your OpenShift Container Platform cluster.
-
You have installed the OpenShift CLI (
oc) as described in the appropriate documentation for your cluster:-
Installing the OpenShift CLI for OpenShift Container Platform
-
Installing the OpenShift CLI for Red Hat OpenShift Service on AWS
-
-
You have configured monitoring for the model serving platform, as described in Configuring monitoring for the multi-model serving platform.
-
You have enabled the TrustyAI component, as described in Enabling the TrustyAI component.
-
If you are using TrustyAI with a database instead of PVC, you have configured TrustyAI to use the database, as described in Configuring TrustyAI with a database.
-
The data scientist has created a project, as described in Creating a project, that contains the models that the data scientist wants to monitor.
Procedure
-
Open a new terminal window.
-
Follow these steps to log in to your OpenShift Container Platform cluster as a cluster administrator:
-
In the OpenShift Container Platform web console, click your user name and select Copy login command.
-
After you have logged in, click Display token.
-
Copy the Log in with this token command and paste it in the OpenShift CLI (
oc).$ oc login --token=<token> --server=<openshift_cluster_url>
-
-
Navigate to the project that contains the models that the data scientist wants to monitor.
oc project <project_name>For example:
oc project my-project
-
Create a
TrustyAIServicecustom resource (CR) file, for exampletrustyai_crd.yaml:Example CR file for TrustyAI using a databaseapiVersion: trustyai.opendatahub.io/v1 kind: TrustyAIService metadata: name: trustyai-service (1) spec: storage: format: "DATABASE" (2) size: "1Gi" (3) databaseConfigurations: <database_secret_credentials> (4) metrics: schedule: "5s" (5)-
The name of the TrustyAI service instance.
-
The storage format for the data, either
DATABASEorPVC(persistent volume claim). Red Hat recommends that you use a database setup for better scalability, performance, and data management in TrustyAI. -
The size of the data to request.
-
The name of the secret with your database credentials that you created in Configuring TrustyAI with a database. For example,
db-credentials. -
The interval at which to calculate the metrics. The default is
5s. The duration is specified with the ISO-8601 format. For example,5sfor 5 seconds,5mfor 5 minutes, and5hfor 5 hours.
Example CR file for TrustyAI using a PVCapiVersion: trustyai.opendatahub.io/v1 kind: TrustyAIService metadata: name: trustyai-service (1) spec: storage: format: "PVC" (2) folder: "/inputs" (3) size: "1Gi" (4) data: filename: "data.csv" (5) format: "CSV" (6) metrics: schedule: "5s" (7) batchSize: 5000 (8)-
The name of the TrustyAI service instance.
-
The storage format for the data, either
DATABASEorPVC(persistent volume claim). -
The location within the PVC where you want to store the data.
-
The size of the PVC to request.
-
The suffix for the stored data files.
-
The format of the data. Currently, only comma-separated value (CSV) format is supported.
-
The interval at which to calculate the metrics. The default is
5s. The duration is specified with the ISO-8601 format. For example,5sfor 5 seconds,5mfor 5 minutes, and5hfor 5 hours. -
(Optional) The observation’s historical window size to use for metrics calculation. The default is
5000, which means that the metrics are calculated using the 5,000 latest inferences.
-
-
Add the TrustyAI service’s CR to your project:
oc apply -f trustyai_crd.yaml
This command returns output similar to the following:
trusty-service created
Verification
Verify that you installed the TrustyAI service:
oc get pods | grep trustyai
You should see a response similar to the following:
trustyai-service-5d45b5884f-96h5z 1/1 Running
Enabling TrustyAI Integration with KServe RawDeployment
To use the TrustyAI service with KServe RawDeployment mode, you must first update the KServe ConfigMap, then create another ConfigMap in your model’s namespace to hold the Certificate Authority (CA) certificate.
Prerequisites
-
You have installed Open Data Hub.
-
You have cluster administrator privileges for your Open Data Hub cluster.
-
You have access to a data science cluster that has TrustyAI enabled.
-
You have enabled the model serving platform.
Procedure
-
Update the KServe ConfigMap (
inferenceservice-config) in the Open Data Hub UI:-
From the OpenShift console, click Workloads → ConfigMaps.
-
From the project drop-down list, select the
opendatahub-ods-applicationsnamespace. -
Find the
inferenceservice-configConfigMap. -
Click the options menu (⋮) for that ConfigMap, and then click Edit ConfigMap.
-
Add the following parameters to the logger key:
"caBundle": "kserve-logger-ca-bundle", "caCertFile": "service-ca.crt", "tlsSkipVerify": false -
Click Save.
-
-
Create a ConfigMap in your model’s namespace to hold the CA certificate:
-
Click Create Config Map.
-
Enter the following code in the created ConfigMap:
  apiVersion: v1
   kind: ConfigMap
   metadata:
     name: kserve-logger-ca-bundle
     namespace: <your-model-namespace>
     annotations:
       service.beta.openshift.io/inject-cabundle: "true"
   data: {}
-
-
Click Save.
|
Note
|
The |
Verification
When you send inferences to your KServe Raw model, TrustyAI acknowledges the data capture in the output logs.
|
Note
|
If you do not observe any data on the Trusty AI logs, complete these configuration steps and redeploy the pod. |
Setting up TrustyAI for your project
To set up model monitoring with TrustyAI for a project, a data scientist does the following tasks:
-
Authenticate the TrustyAI service
-
Upload and send training data to TrustyAI for bias or data drift monitoring
-
Label your data fields (optional)
After setting up, a data scientist can create and view bias and data drift metrics for deployed models.
Authenticating the TrustyAI service
To access TrustyAI service external endpoints, you must provide OAuth proxy (oauth-proxy) authentication. You must obtain a user token, or a token from a service account with sufficient privileges, and then pass the token to the TrustyAI service when using curl commands.
Prerequisites
-
You have installed the OpenShift CLI (
oc) as described in the appropriate documentation for your cluster:-
Installing the OpenShift CLI for OpenShift Container Platform
-
Installing the OpenShift CLI for Red Hat OpenShift Service on AWS
-
-
Your OpenShift cluster administrator added you as a user to the OpenShift Container Platform cluster and has installed the TrustyAI service for the project that contains the deployed models.
Procedure
-
Open a new terminal window.
-
Follow these steps to log in to your OpenShift Container Platform cluster:
-
In the upper-right corner of the OpenShift web console, click your user name and select Copy login command.
-
After you have logged in, click Display token.
-
Copy the Log in with this token command and paste it in the OpenShift CLI (
oc).$ oc login --token=<token> --server=<openshift_cluster_url>
-
-
Enter the following command to set a user token variable on OpenShift Container Platform:
export TOKEN=$(oc whoami -t)
Verification
-
Enter the following command to check the user token variable:
echo $TOKEN
Next step
When running curl commands, pass the token to the TrustyAI service using the Authorization header. For example:
curl -H "Authorization: Bearer $TOKEN" $TRUSTY_ROUTE
Uploading training data to TrustyAI
Upload training data to use with TrustyAI for bias monitoring or data drift detection.
Prerequisites
-
Your cluster administrator added you as a user to the OpenShift Container Platform cluster and has installed the TrustyAI service for the project that contains the deployed models.
-
You have model training data to upload.
-
You authenticated the TrustyAI service as described in Authenticating the TrustyAI service.
Procedure
-
Set the
TRUSTY_ROUTEvariable to the external route for the TrustyAI service in your project:TRUSTY_ROUTE=https://$(oc get route/trustyai-service --template={{.spec.host}}) -
Send the training data to the
/data/uploadendpoint:curl -sk $TRUSTY_ROUTE/data/upload \ --header 'Authorization: Bearer ${TOKEN}' \ --header 'Content-Type: application/json' \ -d @data/training_data.jsonThe following message is displayed if the upload was successful:
1000 datapoints successfully added to gaussian-credit-model data.
Verification
-
Verify that TrustyAI has received the data via the
/infoendpoint by inputting this query:curl -H 'Authorization: Bearer ${TOKEN}' \ $TRUSTY_ROUTE/info | jq ".[0].data"The output returns a json file containing the following information for the model:
-
The names, data types, and positions of fields in the input and output.
-
The observed values that these fields take. This value is usually
nullbecause there are too many unique feature values to enumerate. -
The total number of input-output pairs observed. It should be
1000.
-
Sending training data to TrustyAI
To use TrustyAI for bias monitoring or data drift detection, you must send training data for your model to TrustyAI.
Prerequisites
-
Your OpenShift cluster administrator added you as a user to the OpenShift Container Platform cluster and has installed the TrustyAI service for the project that contains the deployed models.
-
You authenticated the TrustyAI service as described in Authenticating the TrustyAI service.
-
You have uploaded model training data to TrustyAI.
-
Your deployed model is registered with TrustyAI.
Procedure
-
Verify that the TrustyAI service has registered your deployed model:
-
In the OpenShift Container Platform console, go to Workloads → Pods.
-
From the project list, select the project that contains your deployed model.
-
Inspect the
InferenceServicefor your deployed model. For example, run the following command:oc describe inferenceservice my-model -n my-namespace -
When inspecting the
InferenceService, you should see the following field in the specification:Logger: # ... Mode: all URL: https://trustyai-service.my-namespace.svc.cluster.local
-
-
Set the
TRUSTY_ROUTEvariable to the external route for the TrustyAI service pod:TRUSTY_ROUTE=https://$(oc get route/trustyai-service --template={{.spec.host}}) -
Get the inference endpoints for the deployed model, as described in Accessing the inference endpoint for a deployed model.
-
Send data to this endpoint. For more information, see the KServe v2 Inference Protocol documentation.
Verification
Follow these steps to view cluster metrics and verify that TrustyAI is receiving data.
-
Log in to the OpenShift Container Platform web console.
-
Switch to the Developer perspective.
-
In the left menu, click Observe.
-
On the Metrics page, click the Select query list and then select Custom query.
-
In the Expression field, enter
trustyai_model_observations_totaland press Enter. Your model should be listed and reporting observed inferences. -
Optional: Select a time range from the list above the graph. For example, select 5m.
Labeling data fields
After you send model training data to TrustyAI, you might want to apply a set of name mappings to your inputs and outputs so that the field names are meaningful and easier to work with.
Prerequisites
-
Your OpenShift cluster administrator added you as a user to the OpenShift Container Platform cluster and has installed the TrustyAI service for the project that contains the deployed models.
-
You sent training data to TrustyAI as described in Sending training data to TrustyAI.
Procedure
-
Open a new terminal window.
-
Follow these steps to log in to your OpenShift Container Platform cluster:
-
In the upper-right corner of the OpenShift web console, click your user name and select Copy login command.
-
After you have logged in, click Display token.
-
Copy the Log in with this token command and paste it in the OpenShift CLI (
oc).$ oc login --token=<token> --server=<openshift_cluster_url>
-
-
In the OpenShift CLI (
oc), get the route to the TrustyAI service:TRUSTY_ROUTE=https://$(oc get route/trustyai-service --template={{.spec.host}}) -
To examine TrustyAI’s model metadata, query the
/infoendpoint:curl -H "Authorization: Bearer $TOKEN" $TRUSTY_ROUTE/info | jq ".[0].data"This outputs a JSON file containing the following information for each model:
-
The names, data types, and positions of input fields and output fields.
-
The observed field values.
-
The total number of input-output pairs observed.
-
-
Use
POST /info/namesto apply name mappings to the fields, similar to the following example.Change the
model-name,original-name, andPredictionvalues to those used in your model. Change theNew namevalues to the labels that you want to use.curl -sk -H "Authorization: Bearer $TOKEN" -X POST --location $TRUSTY_ROUTE/info/names \ -H "Content-Type: application/json" \ -d "{ \"modelId\": \"model-name\", \"inputMapping\": { \"original-name-0\": \"New name 0\", \"original-name-1\": \"New name 1\", \"original-name-2\": \"New name 2\", \"original-name-3\": \"New name 3\", }, \"outputMapping\": { \"predict-0\": \"Prediction 0\" } }"
Verification
A "Feature and output name mapping successfully applied" message is displayed.
Monitoring model bias
As a data scientist or machine learning engineer, you can monitor your models for bias, such as algorithmic deficiencies that might skew the outcomes or decisions that the model produces. This type of monitoring can help ensure that the model is not biased against specific groups of people or personal traits.
Open Data Hub provides a set of metrics that help you to monitor your models for bias. You can use the Open Data Hub interface to choose an available metric and then configure model-specific details such as a protected attribute, the privileged and unprivileged groups, the outcome you want to monitor, and a threshold for bias. You then see a chart of the calculated values for a specified number of model inferences.
For more information about the specific bias metrics, see Using bias metrics.
Creating a bias metric
To monitor a deployed model for bias, you must first create bias metrics. When you create a bias metric, you specify details relevant to your model such as a protected attribute, privileged and unprivileged groups, a model outcome and a value that you want to monitor, and the acceptable threshold for bias.
For information about the specific bias metrics, see Using bias metrics.
For the complete list of TrustyAI metrics, see TrustyAI service API.
You can create a bias metric for a model by using the Open Data Hub dashboard or by using the OpenShift CLI (oc).
Creating a bias metric by using the dashboard
You can use the Open Data Hub dashboard to create a bias metric for a model.
Prerequisites
-
You are familiar with the bias metrics that you can use with Open Data Hub and how to interpret them.
-
You are familiar with the specific data set schema and understand the names and meanings of the inputs and outputs.
-
Your OpenShift cluster administrator added you as a user to the OpenShift Container Platform cluster and has installed the TrustyAI service for the project that contains the deployed models.
-
You set up TrustyAI for your project, as described in Setting up TrustyAI for your project.
Procedure
-
Optional: To set the
TRUSTY_ROUTEvariable, follow these steps.-
In a terminal window, log in to the OpenShift cluster where Open Data Hub is deployed.
oc login
-
Set the
TRUSTY_ROUTEvariable to the external route for the TrustyAI service pod.TRUSTY_ROUTE=https://$(oc get route/trustyai-service --template={{.spec.host}})
-
-
In the left menu of the Open Data Hub dashboard, click AI hub → Deployments.
-
On the Deployments page, select your project from the drop-down list.
-
Click the name of the model that you want to configure bias metrics for.
-
On the metrics page for the model, click the Model bias tab.
-
Click Configure.
-
In the Configure bias metrics dialog, complete the following steps to configure bias metrics:
-
In the Metric name field, type a unique name for your bias metric. Note that you cannot change the name of this metric later.
-
From the Metric type list, select one of the metrics types that are available in Open Data Hub.
-
In the Protected attribute field, type the name of an attribute in your model that you want to monitor for bias.
TipYou can use a curlcommand to query the metadata endpoint and view input attribute names and values. For example:curl -H "Authorization: Bearer $TOKEN" $TRUSTY_ROUTE/info | jq ".[0].data.inputSchema" -
In the Privileged value field, type the name of a privileged group for the protected attribute that you specified.
-
In the Unprivileged value field, type the name of an unprivileged group for the protected attribute that you specified.
-
In the Output field, type the name of the model outcome that you want to monitor for bias.
TipYou can use a curlcommand to query the metadata endpoint and view output attribute names and values. For example:curl -H "Authorization: Bearer $TOKEN" $TRUSTY_ROUTE/info | jq ".[0].data.outputSchema" -
In the Output value field, type the value of the outcome that you want to monitor for bias.
-
In the Violation threshold field, type the bias threshold for your selected metric type. This threshold value defines how far the specified metric can be from the fairness value for your metric, before the model is considered biased.
-
In the Metric batch size field, type the number of model inferences that Open Data Hub includes each time it calculates the metric.
-
-
Ensure that the values you entered are correct.
NoteYou cannot edit a model bias metric configuration after you create it. Instead, you can duplicate a metric and then edit (configure) it; however, the history of the original metric is not applied to the copy.
-
Click Configure.
Verification
-
The Bias metric configuration page shows the bias metrics that you configured for your model.
Next step
To view metrics, on the Bias metric configuration page, click View metrics in the upper-right corner.
Creating a bias metric by using the CLI
You can use the OpenShift CLI (oc) to create a bias metric for a model.
Prerequisites
-
You are familiar with the bias metrics that you can use with Open Data Hub and how to interpret them.
-
You are familiar with the specific data set schema and understand the names and meanings of the inputs and outputs.
-
Your OpenShift cluster administrator added you as a user to the OpenShift Container Platform cluster and has installed the TrustyAI service for the project that contains the deployed models.
-
You set up TrustyAI for your project, as described in Setting up TrustyAI for your project.
Procedure
-
In a terminal window, log in to the OpenShift cluster where Open Data Hub is deployed.
oc login
-
Set the
TRUSTY_ROUTEvariable to the external route for the TrustyAI service pod.TRUSTY_ROUTE=https://$(oc get route/trustyai-service --template={{.spec.host}}) -
Optionally, get the full list of TrustyAI service endpoints and payloads.
curl -H "Authorization: Bearer $TOKEN" --location $TRUSTY_ROUTE/q/openapi
-
Use
POST /metrics/group/fairness/spd/requestto schedule a recurring bias monitoring metric with the following syntax and payload structure:Syntax:
curl -sk -H "Authorization: Bearer $TOKEN" -X POST --location $TRUSTY_ROUTE/metrics/group/fairness/spd/request  \
 --header 'Content-Type: application/json' \
 --data <payload>
Payload structure:
modelId-
The name of the model to query.
protectedAttribute-
The name of the feature that distinguishes the groups that you are checking for fairness.
privilegedAttribute-
The suspected favored (positively biased) class.
unprivilegedAttribute-
The suspected unfavored (negatively biased) class.
outcomeName-
The name of the output that provides the output you are examining for fairness.
favorableOutcome-
The value of the
outcomeNameoutput that describes the favorable or desired model prediction. batchSize-
The number of previous inferences to include in the calculation.
For example:
curl -sk -H "Authorization: Bearer $TOKEN" -X POST --location $TRUSTY_ROUTE /metrics/group/fairness/spd/request \
     --header 'Content-Type: application/json' \
     --data "{
                 \"modelId\": \"demo-loan-nn-onnx-alpha\",
                 \"protectedAttribute\": \"Is Male-Identifying?\",
                 \"privilegedAttribute\": 1.0,
                 \"unprivilegedAttribute\": 0.0,
                 \"outcomeName\": \"Will Default?\",
                 \"favorableOutcome\": 0,
                 \"batchSize\": 5000
             }"
Verification
The bias metrics request should return output similar to the following:
{
   "timestamp":"2023-10-24T12:06:04.586+00:00",
   "type":"metric",
   "value":-0.0029676404469311524,
   "namedValues":null,
   "specificDefinition":"The SPD of -0.002968 indicates that the likelihood of Group:Is Male-Identifying?=1.0 receiving Outcome:Will Default?=0 was -0.296764 percentage points lower than that of Group:Is Male-Identifying?=0.0.",
   "name":"SPD",
   "id":"d2707d5b-cae9-41aa-bcd3-d950176cbbaf",
   "thresholds":{"lowerBound":-0.1,"upperBound":0.1,"outsideBounds":false}
}
The specificDefinition field helps you understand the real-world interpretation of these metric values. For this example, the model is fair over the Is Male-Identifying? field, with the rate of positive outcome only differing by about -0.3%.
Duplicating a bias metric
If you want to edit an existing metric, you can duplicate (copy) it in the Open Data Hub interface and then edit the values in the copy. However, note that the history of the original metric is not applied to the copy.
Prerequisites
-
You are familiar with the bias metrics that you can use with Open Data Hub and how to interpret them.
-
You are familiar with the specific data set schema and understand the names and meanings of the inputs and outputs.
-
There is an existing bias metric that you want to duplicate.
Procedure
-
In the left menu of the Open Data Hub dashboard, click AI hub → Deployments.
-
On the Deployments page, click the name of the model with the bias metric that you want to duplicate.
-
On the metrics page for the model, click the Model bias tab.
-
Click Configure.
-
On the Bias metric configuration page, click the action menu (⋮) next to the metric that you want to copy and then click Duplicate.
-
In the Configure bias metric dialog, follow these steps:
-
In the Metric name field, type a unique name for your bias metric. Note that you cannot change the name of this metric later.
-
Change the values of the fields as needed. For a description of these fields, see Creating a bias metric by using the dashboard.
-
-
Ensure that the values you entered are correct, and then click Configure.
Verification
-
The Bias metric configuration page shows the bias metrics that you configured for your model.
Next step
To view metrics, on the Bias metric configuration page, click View metrics in the upper-right corner.
Deleting a bias metric
You can delete a bias metric for a model by using the Open Data Hub dashboard or by using the OpenShift CLI (oc).
Deleting a bias metric by using the dashboard
You can use the Open Data Hub dashboard to delete a bias metric for a model.
Prerequisites
-
You have logged in to Open Data Hub.
-
There is an existing bias metric that you want to delete.
Procedure
-
In the left menu of the Open Data Hub dashboard, click AI hub → Deployments.
-
On the Deployments page, click the name of the model with the bias metric that you want to delete.
-
On the metrics page for the model, click the Model bias tab.
-
Click Configure.
-
Click the action menu (⋮) next to the metric that you want to delete and then click Delete.
-
In the Delete bias metric dialog, type the metric name to confirm the deletion.
NoteYou cannot undo deleting a bias metric.
-
Click Delete bias metric.
Verification
-
The Bias metric configuration page does not show the bias metric that you deleted.
Deleting a bias metric by using the CLI
You can use the OpenShift CLI (oc) to delete a bias metric for a model.
Prerequisites
-
You have installed the OpenShift CLI (
oc) as described in the appropriate documentation for your cluster:-
Installing the OpenShift CLI for OpenShift Container Platform
-
Installing the OpenShift CLI for Red Hat OpenShift Service on AWS
-
-
You have a user token for authentication as described in Authenticating the TrustyAI service.
-
There is an existing bias metric that you want to delete.
Procedure
-
Open a new terminal window.
-
Follow these steps to log in to your OpenShift Container Platform cluster:
-
In the upper-right corner of the OpenShift web console, click your user name and select Copy login command.
-
After you have logged in, click Display token.
-
Copy the Log in with this token command and paste it in the OpenShift CLI (
oc).$ oc login --token=<token> --server=<openshift_cluster_url>
-
-
In the OpenShift CLI (
oc), get the route to the TrustyAI service:TRUSTY_ROUTE=https://$(oc get route/trustyai-service --template={{.spec.host}}) -
Optional: To list all currently active requests for a metric, use
GET /metrics/{{metric}}/requests. For example, to list all currently scheduled SPD metrics, type:curl -H "Authorization: Bearer $TOKEN" -X GET --location "$TRUSTY_ROUTE/metrics/spd/requests"
Alternatively, to list all currently scheduled metric requests, use
GET /metrics/all/requests.curl -H "Authorization: Bearer $TOKEN" -X GET --location "$TRUSTY_ROUTE/metrics/all/requests"
-
To delete a metric, send an HTTP
DELETErequest to the/metrics/$METRIC/requestendpoint to stop the periodic calculation, including the id of periodic task that you want to cancel in the payload. For example:curl -H "Authorization: Bearer $TOKEN" -X DELETE --location "$TRUSTY_ROUTE/metrics/spd/request" \ -H "Content-Type: application/json" \ -d "{ \"requestId\": \"3281c891-e2a5-4eb3-b05d-7f3831acbb56\" }"
Verification
Use GET /metrics/{{metric}}/requests to list all currently active requests for the metric and verify the metric that you deleted is not shown. For example:
curl -H "Authorization: Bearer $TOKEN" -X GET --location "$TRUSTY_ROUTE/metrics/spd/requests"
Viewing bias metrics for a model
After you create bias monitoring metrics, you can use the Open Data Hub dashboard to view and update the metrics that you configured.
Prerequisite
-
You configured bias metrics for your model as described in Creating a bias metric.
Procedure
-
In the Open Data Hub dashboard, click AI hub → Deployments.
-
On the Deployments page, click the name of a model that you want to view bias metrics for.
-
On the metrics page for the model, click the Model bias tab.
-
To update the metrics shown on the page, follow these steps:
-
In the Metrics to display section, use the Select a metric list to select a metric to show on the page.
NoteEach time you select a metric to show on the page, an additional Select a metric list is displayed. This enables you to show multiple metrics on the page. -
From the Time range list in the upper-right corner, select a value.
-
From the Refresh interval list in the upper-right corner, select a value.
The metrics page shows the metrics that you selected.
-
-
Optional: To remove one or more metrics from the page, in the Metrics to display section, perform one of the following actions:
-
To remove an individual metric, click the cancel icon (✖) next to the metric name.
-
To remove all metrics, click the cancel icon (✖) in the Select a metric list.
-
-
Optional: To return to configuring bias metrics for the model, on the metrics page, click Configure in the upper-right corner.
Verification
-
The metrics page shows the metrics selections that you made.
Using bias metrics
You can use the following bias metrics in Open Data Hub:
- Statistical Parity Difference
-
Statistical Parity Difference (SPD) is the difference in the probability of a favorable outcome prediction between unprivileged and privileged groups. The formal definition of SPD is the following:

-
ŷ = 1 is the favorable outcome.
-
Dᵤ and Dₚ are the unprivileged and privileged group data.
You can interpret SPD values as follows:
-
A value of
0means that the model is behaving fairly for a selected attribute (for example, race, gender). -
A value in the range
-0.1to0.1means that the model is reasonably fair for a selected attribute. Instead, you can attribute the difference in probability to other factors, such as the sample size. -
A value outside the range
-0.1to0.1indicates that the model is unfair for a selected attribute. -
A negative value indicates that the model has bias against the unprivileged group.
-
A positive value indicates that the model has bias against the privileged group.
-
- Disparate Impact Ratio
-
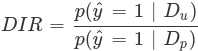
Disparate Impact Ratio (DIR) is the ratio of the probability of a favorable outcome prediction for unprivileged groups to that of privileged groups. The formal definition of DIR is the following:
-
ŷ = 1 is the favorable outcome.
-
Dᵤ and Dₚ are the unprivileged and privileged group data.
The threshold to identify bias depends on your own criteria and specific use case.
For example, if your threshold for identifying bias is represented by a DIR value below
0.8or above1.2, you can interpret the DIR values as follows:-
A value of
1means that the model is fair for a selected attribute. -
A value of between
0.8and1.2means that the model is reasonably fair for a selected attribute. -
A value below
0.8or above1.2indicates bias.
-
Monitoring data drift
Data drift refers to changes that occur in the distribution of incoming data that differ significantly from the data on which the model was originally trained. This distributional shift can cause model performance to become unreliable, because machine learning models rely heavily on the patterns in their training data.
Detecting data drift helps ensure that your models continue to perform as expected and that they remain accurate and reliable. Trusty AI measures the statistical alignment between a model’s training data and its incoming inference data using specialized metrics.
Metrics for drift detection include:
-
Mean-Shift
-
FourierMMD
-
Kolmogorov-Smirnov
-
ApproxKSTest
Creating a drift metric
To monitor a deployed model for data drift, you must first create drift metrics.
For information about the specific data drift metrics, see Using drift metrics.
For the complete list of TrustyAI metrics, see TrustyAI service API.
Creating a drift metric by using the CLI
You can use the OpenShift CLI (oc) to create a data drift metric for a model.
Prerequisites
-
You are familiar with the specific data set schema and understand the relevant inputs and outputs.
-
Your OpenShift cluster administrator added you as a user to the OpenShift Container Platform cluster and has installed the TrustyAI service for the project that contains the deployed models.
-
You set up TrustyAI for your project, as described in Setting up TrustyAI for your project.
Procedure
-
Open a new terminal window.
-
Follow these steps to log in to your OpenShift Container Platform cluster:
-
In the upper-right corner of the OpenShift web console, click your user name and select Copy login command.
-
After you have logged in, click Display token.
-
Copy the Log in with this token command and paste it in the OpenShift CLI (
oc).$ oc login --token=<token> --server=<openshift_cluster_url>
-
-
Set the
TRUSTY_ROUTEvariable to the external route for the TrustyAI service pod.TRUSTY_ROUTE=https://$(oc get route/trustyai-service --template={{.spec.host}}) -
Optionally, get the full list of TrustyAI service endpoints and payloads.
curl -H "Authorization: Bearer $TOKEN" --location $TRUSTY_ROUTE/q/openapi
-
Use
POST /metrics/drift/meanshift/requestto schedule a recurring drift monitoring metric with the following syntax and payload structure:Syntax:
curl -k -H "Authorization: Bearer $TOKEN" -X POST --location $TRUSTY_ROUTE/metrics/drift/meanshift/request \
 --header 'Content-Type: application/json' \
 --data <payload>
Payload structure:
modelId-
The name of the model to monitor.
referenceTag-
The data to use as the reference distribution.
For example:
curl -k -H "Authorization: Bearer $TOKEN" -X POST --location $TRUSTY_ROUTE/metrics/drift/meanshift/request \
     --header 'Content-Type: application/json' \
     --data "{
                 \"modelId\": \"gaussian-credit-model\",
                 \"referenceTag\": \"TRAINING\"
             }"
Deleting a drift metric by using the CLI
You can use the OpenShift CLI (oc) to delete a drift metric for a model.
Prerequisites
-
You have installed the OpenShift CLI (
oc) as described in the appropriate documentation for your cluster:-
Installing the OpenShift CLI for OpenShift Container Platform
-
Installing the OpenShift CLI for Red Hat OpenShift Service on AWS
-
-
You have a user token for authentication as described in Authenticating the TrustyAI service.
-
There is an existing drift metric that you want to delete.
Procedure
-
Open a new terminal window.
-
Follow these steps to log in to your OpenShift Container Platform cluster:
-
In the OpenShift Container Platform web console, click your user name and select Copy login command.
-
After you have logged in, click Display token.
-
Copy the Log in with this token command and paste it in the OpenShift CLI (
oc).$ oc login --token=<token> --server=<openshift_cluster_url>
-
-
In the OpenShift CLI (
oc), get the route to the TrustyAI service:TRUSTY_ROUTE=https://$(oc get route/trustyai-service --template={{.spec.host}}) -
Optional: To list all currently active requests for a metric, use
GET /metrics/{{metric}}/requests. For example, to list all currently scheduled MeanShift metrics, type:curl -k -H "Authorization: Bearer $TOKEN" -X GET --location "$TRUSTY_ROUTE/metrics/drift/meanshift/requests"
Alternatively, to list all currently scheduled metric requests, use
GET /metrics/all/requests.curl -H "Authorization: Bearer $TOKEN" -X GET --location "$TRUSTY_ROUTE/metrics/all/requests"
-
To delete a metric, send an HTTP
DELETErequest to the/metrics/$METRIC/requestendpoint to stop the periodic calculation, including the id of periodic task that you want to cancel in the payload. For example:curl -k -H "Authorization: Bearer $TOKEN" -X DELETE --location "$TRUSTY_ROUTE/metrics/drift/meanshift/request" \ -H "Content-Type: application/json" \ -d "{ \"requestId\": \"$id\" }"
Verification
Use GET /metrics/{{metric}}/requests to list all currently active requests for the metric and verify the metric that you deleted is not shown. For example:
curl -H "Authorization: Bearer $TOKEN" -X GET --location "$TRUSTY_ROUTE/metrics/drift/meanshift/requests"
Viewing drift metrics for a model
After you create data drift monitoring metrics, use the OpenShift Container Platform web console to view and update the drift metrics that you configured.
Prerequisites
-
You have been assigned the
monitoring-rules-viewrole. For more information, see Granting users permission to configure monitoring for user-defined projects. -
You are familiar with how to monitor project metrics in the OpenShift Container Platform web console. For more information, see Monitoring your project metrics.
Procedure
-
Log in to the OpenShift Container Platform web console.
-
Switch to the Developer perspective.
-
In the left menu, click Observe.
-
As described in Monitoring your project metrics, use the web console to run queries for
trustyai_*metrics.
Using drift metrics
You can use the following data drift metrics in Open Data Hub:
- MeanShift
-
The MeanShift metric calculates the per-column probability that the data values in a test data set are from the same distribution as those in a training data set (assuming that the values are normally distributed). This metric measures the difference in the means of specific features between the two datasets.
MeanShift is useful for identifying straightforward changes in data distributions, such as when the entire distribution has shifted to the left or right along the feature axis.
This metric returns the probability that the distribution seen in the "real world" data is derived from the same distribution as the reference data. The closer the value is to 0, the more likely there is to be significant drift.
- FourierMMD
-
The FourierMMD metric provides the probability that the data values in a test data set have drifted from the training data set distribution, assuming that the computed Maximum Mean Discrepancy (MMD) values are normally distributed. This metric compares the empirical distributions of the data sets by using an MMD measure in the Fourier domain.
FourierMMD is useful for detecting subtle shifts in data distributions that might be overlooked by simpler statistical measures.
This metric returns the probability that the distribution seen in the "real world" data has drifted from the reference data. The closer the value is to 1, the more likely there is to be significant drift.
- KSTest
-
The KSTest metric calculates two Kolmogorov-Smirnov tests for each column to determine whether the data sets are derived from the same distributions. This metric measures the maximum distance between the empirical cumulative distribution functions (CDFs) of the data sets, without assuming any specific underlying distribution.
KSTest is useful for detecting changes in distribution shape, location, and scale.
This metric returns the probability that the distribution seen in the "real world" data is derived from the same distribution as the reference data. The closer the value is to 0, the more likely there is to be significant drift.
- ApproxKSTest
-
The ApproxKSTest metric performs an approximate Kolmogorov-Smirnov test, ensuring that the maximum error is
6*epsiloncompared to an exact KSTest.ApproxKSTest is useful for detecting changes in distributions for large data sets where performing an exact KSTest might be computationally expensive.
This metric returns the probability that the distribution seen in the "real world" data is derived from the same distribution as the reference data. The closer the value is to 0, the more likely there is to be significant drift.
Using a drift metric in a credit card scenario
This example scenario deploys an XGBoost model into your cluster and reviews its output using a drift metric.
The XGBoost model was created for the purpose of this demonstration and predicts credit card approval based on the following features: age, credit score, years of education, and years in employment.
When the model is deployed and the data that you upload is formatted, use the mean shift metric to monitor for data drift. This metric is useful for ensuring that a model remains accurate and reliable in a production environment.
Mean shift compares a numeric test dataset against a numeric training dataset. It produces a p-value that measures the probability the test data has originated from the same numeric distribution as the training data. A p-value less than 0.05 indicates a statistically significant drift between the two datasets. A p-value equal to or greater than 0.05 indicates no statistically significant evidence of drift.
|
Note
|
Mean shift performs best when each feature in the data is normally distributed. Choose a different metric for working with different or unknown data distributions. |
Prerequisites
-
Your cluster administrator added you as a user to the cluster and configured TrustyAI for use in the project that contains the deployed models.
-
You set up TrustyAI for your project, as described in Setting up TrustyAI for your project.
Procedure
-
Obtain a bearer token to authenticate your external endpoints by running the following command:
$ oc apply -f resources/service_account.yaml export TOKEN=$(oc create token user-one) -
In your model namespace, deploy the storage container, serving runtime, and the credit model:
$ oc project model-namespace || true $ oc apply -f resources/model_storage_container.yaml $ oc apply -f resources/odh-mlserver-1.x.yaml $ oc apply -f resources/model_gaussian_credit.yaml -
Set the route for your data upload:
TRUSTY_ROUTE=https://$(oc get route/trustyai-service --template={{.spec.host}}) -
Download the training data payload (file size 472 KB):
wget https://github.com/trustyai-explainability/odh-trustyai-demos/blob/72f748da9410f92a60bea73ce5e3f47c10ad1cea/3-DataDrift/kserve-demo/data/training_data.json -O training_data.json -
Label your model training data. This data has four main fields. The
model_nameanddata_tagfields require a label because they are directly referenced in the Metrics dashboard later in the scenario. In addition to the required fields, it is best to also label response and request fields. The four fields are:-
model_name: The name of the model that correlates to this data. The name should match that of the model provided in the model YAML, which isgaussian-credit-model. -
data_tag: A string tag to reference this particular set of data. Use the string"TRAINING". -
request: This is a KServe inference request, as if you were sending this data directly to the model server’s/inferendpoint. -
response: The KServe inference response that is returned from sending the above request to the model.
-
-
Upload the model training data to the TrustyAI endpoint:
curl -sk -H "Authorization: Bearer ${TOKEN}" $TRUSTY_ROUTE/data/upload  \
 --header 'Content-Type: application/json' \
 -d @training_data.json
The following message appears confirming the data upload:
1000 datapoints successfully added to gaussian-credit-model data. -
Label your model input and output fields with the actual column names of the data in your KServe payloads. Send a JSON payload containing a simple set of
original-name:new-name pairs, assigning new meaningful names to the input and output features of your model. A message that says "Feature and output name mapping successfully applied" appears if the request is successful:curl -sk -H "Authorization: Bearer ${TOKEN}" -X POST --location $TRUSTY_ROUTE/info/names \ -H "Content-Type: application/json" \ -d "{ \"modelId\": \"gaussian-credit-model\", \"inputMapping\": { \"credit_inputs-0\": \"Age\", \"credit_inputs-1\": \"Credit Score\", \"credit_inputs-2\": \"Years of Education\", \"credit_inputs-3\": \"Years of Employment\" }, \"outputMapping\": { \"predict-0\": \"Acceptance Probability\" } }"TipDefine name mappings in TrustyAI to assign memorable names to input or output names. These names can then be used in subsequent requests to the TrustyAI service.
-
Verify that TrustyAI has received the data by querying the
/infoendpoint:curl -H "Authorization: Bearer ${TOKEN}" $TRUSTY_ROUTE/info | jq '.["gaussian-credit-model"].data.inputSchema' -
The following output appears as a JSON file confirming that TrustyAI has successfully received the data:
{ "items": { "Years of Education": { "type": "DOUBLE", "name": "credit_inputs-2", "columnIndex": 2 }, "Years of Employment": { "type": "DOUBLE", "name": "credit_inputs-3", "columnIndex": 3 }, "Age": { "type": "DOUBLE", "name": "credit_inputs-0", "columnIndex": 0 }, "Credit Score": { "type": "DOUBLE", "name": "credit_inputs-1", "columnIndex": 1 } }, "nameMapping": { "credit_inputs-0": "Age", "credit_inputs-1": "Credit Score", "credit_inputs-2": "Years of Education", "credit_inputs-3": "Years of Employment" } } -
Create a recurring drift monitoring metric using
/metrics/drift/meanshift/request. This will measure the drift of all recorded inference data against the reference distribution. The body of the payload requires amodelIdthat sets which model to monitor and a referenceTag that determines which data to use as the reference distribution. The values of these fields should match themodelIdandreferenceTaginside your data upload payload:curl -k -H "Authorization: Bearer ${TOKEN}" -X POST --location $TRUSTY_ROUTE/metrics/drift/meanshift/request -H "Content-Type: application/json" \ -d "{ \"modelId\": \"gaussian-credit-model\", \"referenceTag\": \"TRAINING\" }" -
Check the metrics in the OpenShift console under Observe → Metrics:
-
Set the time window to 5 minutes and the refresh interval to 15 seconds.
-
In the Expression field, enter
trustyai_meanshift.NoteIt may take a few seconds before the cluster monitoring stacks picks up the new metric. You may need to refresh before the new metrics appear, if you’re already in the section of the OpenShift console.
-
-
Observe in the Metric Chart onscreen that a metric is emitted for each of the four features and the single output, making for five measurements in total. All metric values should equal 1 (no drift), because we only have the training data, which can’t drift from itself.
-
Collect some simulated real-world inferences to observe the drift monitoring. To do this, send small batches of data to the model, mimicking a real-world deployment:
-
Get the route to the model:
MODEL=gaussian-credit-model BASE_ROUTE=$(oc get inferenceservice gaussian-credit-model -o jsonpath='{.status.url}') MODEL_ROUTE="${BASE_ROUTE}/v2/models/${MODEL}/infer" -
Download the data batch and send data payloads to your model:
DATA_PATH=sample_trustyai_model_data
mkdir $DATA_PATH
for batch in {0..595..5}; do
	wget https://github.com/trustyai-explainability/odh-trustyai-demos/blob/72f748da9410f92a60bea73ce5e3f47c10ad1cea/3-DataDrift/kserve-demo/data/data_batches/$batch.json -O $DATA_PATH/$batch.json
	curl -sk "${MODEL_ROUTE}"\
  		-H "Authorization: Bearer ${TOKEN}" \
  		-H "Content-Type: application/json" \
  		-d @$DATA_PATH/$batch.json
  	sleep 1
done
-
-
Observe the updated drift metrics in the Observe → Metrics section of the OpenShift console. The mean shift metric values for the various features change:
-
The values for Credit Score, Age, and Acceptance Probability have all dropped to 0, indicating there is a statistically very high likelihood that the values of these fields in the inference data come from a different distribution than that of the training data.
-
The Years of Employment and Years of Education scores have dropped to 0.34 and 0.82 respectively, indicating that there is a little drift, but not enough to be particularly concerning.
-
Using explainability
Learn about how your machine learning model makes its predictions and decisions using explainers from TrustyAI to provide saliency explanations for model inferences in Open Data Hub.
For information about the specific explainers, see Using explainers.
Requesting a LIME explanation
To understand how a model makes its predictions and decisions, you can use a Local Interpretable Model-agnostic Explanations (LIME) explainer. LIME explains a model’s predictions by showing how much each feature affected the outcome. For example, for a model predicting not to target a user for a marketing campaign, LIME provides a list of weights, both positive and negative, indicating how each feature influenced the model’s outcome.
For more information, see Using explainers.
Requesting a LIME explanation by using the CLI
You can use the OpenShift CLI (oc) to request a LIME explanation.
Prerequisites
-
Your OpenShift cluster administrator added you as a user to the OpenShift Container Platform cluster and has installed the TrustyAI service for the project that contains the deployed models.
-
You authenticated the TrustyAI service, as described in Authenticating the TrustyAI service.
-
You have real-world data from the deployed models.
-
You have installed the OpenShift CLI (
oc) as described in the appropriate documentation for your cluster:-
Installing the OpenShift CLI for OpenShift Container Platform
-
Installing the OpenShift CLI for Red Hat OpenShift Service on AWS
-
Procedure
-
Open a new terminal window.
-
Follow these steps to log in to your OpenShift Container Platform cluster:
-
In the upper-right corner of the OpenShift web console, click your user name and select Copy login command.
-
After you have logged in, click Display token.
-
Copy the Log in with this token command and paste it in the OpenShift CLI (
oc).$ oc login --token=<token> --server=<openshift_cluster_url>
-
-
Set an environment variable to define the external route for the TrustyAI service pod.
export TRUSTY_ROUTE=$(oc get route trustyai-service -n $NAMESPACE -o jsonpath='{.spec.host}') -
Set an environment variable to define the name of your model.
export MODEL="model-name"
-
Use
GET /info/inference/ids/${MODEL}to get a list of all inference IDs within your model inference data set.curl -skv -H "Authorization: Bearer ${TOKEN}" \ https://${TRUSTY_ROUTE}/info/inference/ids/${MODEL}?type=organicYou see output similar to the following:
[ { "id":"a3d3d4a2-93f6-4a23-aedb-051416ecf84f", "timestamp":"2024-06-25T09:06:28.75701201" } ] -
Set environment variables to define the two latest inference IDs (highest and lowest predictions).
export ID_LOWEST=$(curl -s ${TRUSTY_ROUTE}/info/inference/ids/${MODEL}?type=organic | jq -r '.[-1].id') export ID_HIGHEST=$(curl -s ${TRUSTY_ROUTE}/info/inference/ids/${MODEL}?type=organic | jq -r '.[-2].id') -
Use
POST /explainers/local/limeto request the LIME explanation with the following syntax and payload structure:Syntax:
curl -sk -H "Authorization: Bearer ${TOKEN}" -X POST \
 -H "Content-Type: application/json" \
 -d <payload>
Payload structure:
PredictionId-
The inference ID.
config-
The configuration for the LIME explanation, including
modelandexplainerparameters. For more information, see Model configuration parameters and LIME explainer configuration parameters.
For example:
echo "Requesting LIME for lowest"
curl -s -H "Authorization: Bearer ${TOKEN}" -X POST \
    -H "Content-Type: application/json" \
    -d "{
        \"predictionId\": \"$ID_LOWEST\",
        \"config\": {
            \"model\": { (1)
                \"target\": \"modelmesh-serving:8033\", (2)
                \"name\": \"${MODEL}\",
                \"version\": \"v1\"
            },
            \"explainer\": { (3)
              \"n_samples\": 50,
              \"normalize_weights\": \"false\",
              \"feature_selection\": \"false\"
            }
        }
    }" \
    ${TRUSTYAI_ROUTE}/explainers/local/lime
echo "Requesting LIME for highest"
curl -sk -H "Authorization: Bearer ${TOKEN}" -X POST \
-H "Content-Type: application/json" \
-d "{
\"predictionId\": \"$ID_HIGHEST\",
\"config\": {
\"model\": { (1)
\"target\": \"modelmesh-serving:8033\", (2)
\"name\": \"${MODEL}\",
\"version\": \"v1\"
},
\"explainer\": { (3)
\"n_samples\": 50,
\"normalize_weights\": \"false\",
\"feature_selection\": \"false\"
}
}
}" \
${TRUSTYAI_ROUTE}/explainers/local/lime-
Specifies configuration for the model. For more information about the model configuration options, see Model configuration parameters.
-
Specifies the model server service URL. This field only accepts model servers in the same namespace as the TrustyAI service, with or without protocol or port number.
-
http[s]://service[:port] -
service[:port]
-
-
Specifies the configuration for the explainer. For more information about the explainer configuration parameters, see LIME explainer configuration parameters.
Requesting a SHAP explanation
To understand how a model makes its predictions and decisions, you can use a SHapley Additive exPlanations (SHAP) explainer. SHAP explains a model’s prediction by showing a detailed breakdown of each feature’s contribution to the final outcome. For example, for a model predicting the price of a house, SHAP provides a list of how much each feature contributed (in monetary value) to the final price.
For more information, see Using explainers.
Requesting a SHAP explanation by using the CLI
You can use the OpenShift CLI (oc) to request a SHAP explanation.
Prerequisites
-
Your OpenShift cluster administrator added you as a user to the OpenShift Container Platform cluster and has installed the TrustyAI service for the project that contains the deployed models.
-
You authenticated the TrustyAI service, as described in Authenticating the TrustyAI service.
-
You have real-world data from the deployed models.
-
You have installed the OpenShift CLI (
oc) as described in the appropriate documentation for your cluster:-
Installing the OpenShift CLI for OpenShift Container Platform
-
Installing the OpenShift CLI for Red Hat OpenShift Service on AWS
-
Procedure
-
Open a new terminal window.
-
Follow these steps to log in to your OpenShift Container Platform cluster:
-
In the upper-right corner of the OpenShift web console, click your user name and select Copy login command.
-
After you have logged in, click Display token.
-
Copy the Log in with this token command and paste it in the OpenShift CLI (
oc).$ oc login --token=<token> --server=<openshift_cluster_url>
-
-
Set an environment variable to define the external route for the TrustyAI service pod.
export TRUSTY_ROUTE=$(oc get route trustyai-service -n $NAMESPACE -o jsonpath='{.spec.host}') -
Set an environment variable to define the name of your model.
export MODEL="model-name"
-
Use
GET /info/inference/ids/${MODEL}to get a list of all inference IDs within your model inference data set.curl -skv -H "Authorization: Bearer ${TOKEN}" \ https://${TRUSTY_ROUTE}/info/inference/ids/${MODEL}?type=organicYou see output similar to the following:
[ { "id":"a3d3d4a2-93f6-4a23-aedb-051416ecf84f", "timestamp":"2024-06-25T09:06:28.75701201" } ] -
Set environment variables to define the two latest inference IDs (highest and lowest predictions).
export ID_LOWEST=$(curl -s ${TRUSTY_ROUTE}/info/inference/ids/${MODEL}?type=organic | jq -r '.[-1].id') export ID_HIGHEST=$(curl -s ${TRUSTY_ROUTE}/info/inference/ids/${MODEL}?type=organic | jq -r '.[-2].id') -
Use
POST /explainers/local/shapto request the SHAP explanation with the following syntax and payload structure:Syntax:
curl -sk -H "Authorization: Bearer ${TOKEN}" -X POST \
 -H "Content-Type: application/json" \
 -d <payload>
Payload structure:
PredictionId-
The inference ID.
config-
The configuration for the SHAP explanation, including
modelandexplainerparameters. For more information, see Model configuration parameters and SHAP explainer configuration parameters.
For example:
echo "Requesting SHAP for lowest"
curl -sk -H "Authorization: Bearer ${TOKEN}" -X POST \
  -H "Content-Type: application/json" \
  -d "{
    \"predictionId\": \"$ID_LOWEST\",
    \"config\": {
        \"model\": { (1)
            \"target\": \"modelmesh-serving:8033\", (2)
            \"name\": \"${MODEL}\",
            \"version\": \"v1\"
        },
        \"explainer\": { (3)
          \"n_samples\": 75
        }
    }
  }" \
  ${TRUSTYAI_ROUTE}/explainers/local/shap
echo "Requesting SHAP for highest"
curl -sk -H "Authorization: Bearer ${TOKEN}" -X POST \
-H "Content-Type: application/json" \
-d "{
\"predictionId\": \"$ID_HIGHEST\",
\"config\": {
\"model\": { (1)
\"target\": \"modelmesh-serving:8033\", (2)
\"name\": \"${MODEL}\",
\"version\": \"v1\"
},
\"explainer\": { (3)
\"n_samples\": 75
}
}
}" \
${TRUSTYAI_ROUTE}/explainers/local/shap-
Specifies configuration for the model. For more information about the model configuration options, see Model configuration parameters.
-
Specifies the model server service URL. This field only accepts model servers in the same namespace as the TrustyAI service, with or without protocol or port number.
-
http[s]://service[:port] -
service[:port]
-
-
Specifies the configuration for the explainer. For more information about the explainer configuration parameters, see SHAP explainer configuration parameters.
Using explainers
You can use the following explainers in Open Data Hub:
LIME
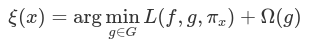
Local Interpretable Model-agnostic Explanations (LIME) [1] is a saliency explanation method. LIME aims to explain a prediction 𝑝 = (𝑥, 𝑦) (an input-output pair) generated by a black-box model 𝑓 : ℝ𝑑 → ℝ. The explanations come in the form of a "saliency" 𝑤𝑖 attached to each feature 𝑥𝑖 in the prediction 𝑥. LIME generates a local explanation ξ(𝑥) according to the following model:
-
𝜋𝑥 is a proximity function
-
𝐺 is the family of interpretable models
-
Ω(𝑔) is a measure of complexity of an explanation 𝑔 ∈ 𝐺
-
𝐿(𝑓, 𝑔, 𝜋𝑥) is a measure of how unfaithful 𝑔 is in approximating 𝑓 in the locality defined by 𝜋𝑥
In the original paper, 𝐺 is the class of linear models and 𝜋𝑥 is an exponential kernel on a distance function 𝐷 (for example, cosine distance). LIME converts samples 𝑥𝑖 from the original domain into interpretable samples as binary vectors 𝑥′𝑖 ∈ 0,1. An encoded data set 𝐸 is built by taking nonzero elements of 𝑥′𝑖 , recovering the original representation 𝑧 ∈ ℝ𝑑 and then computing 𝑓(𝑧). A weighted linear model 𝑔 (with weights provided via 𝜋𝑥) is then trained on the generated sparse data set 𝐸 and the model weights 𝑤 are used as feature weights for the final explanation ξ(𝑥).
SHAP
SHapley Additive exPlanations (SHAP), [2] seeks to unify several common explanation methods, notably LIME [1] and DeepLIFT, [3] under a common umbrella of additive feature attributions. These methods explain how an input 𝑥 = [𝑥1, 𝑥2, …, 𝑥𝑀] affects the output of some model 𝑓 by transforming 𝑥 ∈ ℝ𝑀 into simplified inputs 𝑧′ ∈ 0, 1𝑀 , such that 𝑧′𝑖 indicates the inclusion or exclusion of feature 𝑖. The simplified inputs are then passed to an explanatory model 𝑔 that takes the following form:
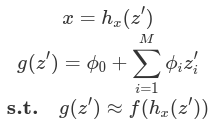
In that form, each value 𝛷𝑖 marks the contribution that feature 𝑖 had on the output model (called the attribution), 𝛷0 marks the null output of the model; the model output when every feature is excluded. Therefore, this presents an easily interpretable explanation of the importance of each feature and a framework to permute the various input features to establish their collection contributions.
The final result of the algorithm are the Shapley values of each feature, which give an itemized "receipt" of all the contributing factors to the decision. For example, a SHAP explanation of a loan application might be as follows:
| Feature | Shapley Value φ |
|---|---|
Null Output |
50% |
Income |
+10% |
# Children |
-15% |
Age |
+22% |
Own Home? |
-30% |
Acceptance% |
37% |
Deny |
63% |
From this, the applicant can see that the biggest contributor to their denial was their home ownership status, which reduced their acceptance probability by 30 percentage points. Meanwhile, their number of children was of particular benefit, increasing their probability by 22 percentage points.
Evaluating large language models
A large language model (LLM) is a type of artificial intelligence (AI) program that is designed for natural language processing tasks, such as recognizing and generating text.
As a data scientist, you might want to monitor your large language models against a range of metrics, in order to ensure the accuracy and quality of its output. Features such as summarization, language toxicity, and question-answering accuracy can be assessed to inform and improve your model parameters.
Open Data Hub now offers Language Model Evaluation as a Service (LM-Eval-aaS), in a feature called LM-Eval. LM-Eval provides a unified framework to test generative language models on a vast range of different evaluation tasks.
The following sections show you how to create an LMEvalJob custom resource (CR) which allows you to activate an evaluation job and generate an analysis of your model’s ability.
Setting up LM-Eval
LM-Eval is a service designed for evaluating large language models that has been integrated into the TrustyAI Operator.
The service is built on top of two open-source projects:
-
LM Evaluation Harness, developed by EleutherAI, that provides a comprehensive framework for evaluating language models
-
Unitxt, a tool that enhances the evaluation process with additional functionalities
The following information explains how to create an LMEvalJob custom resource (CR) to initiate an evaluation job and get the results.
|
Note
|
LM-Eval is only available in the latest community builds. To use LM-Eval on Open Data Hub, ensure that you use ODH 2.20 or later versions and add the following |
Global settings for LM-Eval
Configurable global settings for LM-Eval services are stored in the TrustyAI operator global ConfigMap, named trustyai-service-operator-config. The global settings are located in the same namespace as the operator.
You can configure the following properties for LM-Eval:
| Property | Default | Description |
|---|---|---|
|
|
Detect if there are GPUs available and assign a value for the |
|
|
The image for the LM-Eval job. The image contains the Python packages for LM Evaluation Harness and Unitxt. |
|
|
The image for the LM-Eval driver. For detailed information about the driver, see the |
|
|
The image-pulling policy when running the evaluation job. |
|
8 |
The default batch size when invoking the model inference API. Default batch size is only available for local models. |
|
24 |
The maximum batch size that users can specify in an evaluation job. |
|
10s |
The interval to check the job pod for an evaluation job. |
After updating the settings in the ConfigMap, restart the operator to apply the new values.
Enabling external resource access for LMEval jobs
LMEval jobs do not allow internet access or remote code execution by default. When configuring an LMEvalJob, it may require access to external resources, for example task datasets and model tokenizers, usually hosted on Hugging Face. If you trust the source and have reviewed the content of these artifacts, an LMEvalJob can be configured to automatically download them.
Follow the steps below to enable online access and remote code execution for LMEval jobs. Choose to update these settings by using either the CLI or in the console. Enable one or both settings according to your needs.
Enabling online access and remote code execution for LMEval Jobs using the CLI
You can enable online access using the CLI for LMEval jobs by setting the allowOnline specification to true in the LMEvalJob custom resource (CR). You can also enable remote code execution by setting the allowCodeExecution specification to true. Both modes can be used at the same time.
|
Important
|
Enabling online access or code execution involves a security risk. Only use these configurations if you trust the source(s). |
Prerequisites
-
You have cluster administrator privileges for your OpenShift Container Platform cluster.
Procedure
-
Get the current
DataScienceClusterresource, which is located in theredhat-ods-operatornamespace:$ oc get datasciencecluster -n redhat-ods-operatorExample outputNAME AGE default-dsc 10d -
Enable online access and code execution for the cluster in the
DataScienceClusterresource with thepermitOnlineandpermitCodeExecutionspecifications. For example, create a file namedallow-online-code-exec-dsc.yamlwith the following contents:Exampleallow-online-code-exec-dsc.yamlresource enabling online access and remote code executionapiVersion: datasciencecluster.opendatahub.io/v2 kind: DataScienceCluster metadata: name: default-dsc spec: # ... components: trustyai: managementState: Managed eval: lmeval: permitOnline: allow permitCodeExecution: allow # ...The
permitCodeExecutionandpermitOnlinesettings are disabled by default with a value ofdeny. You must explicitly enable these settings in theDataScienceClusterresource for theLMEvalJobinstance to enable internet access or permission to run any externally downloaded code. -
Apply the updated
DataScienceCluster:$ oc apply -f allow-online-code-exec-dsc.yaml -n redhat-ods-operator-
Optional: Run the following command to check that the
DataScienceClusteris in a healthy state:$ oc get datasciencecluster default-dscExample outputNAME READY REASON default-dsc True
-
-
For new LMEval jobs, define the job in a YAML file as shown in the following example. This configuration requests both internet access, with
allowOnline: true, and permission for remote code execution with,allowCodeExecution: true:Example lmevaljob-with-online-code-exec.yamlapiVersion: trustyai.opendatahub.io/v1alpha1 kind: LMEvalJob metadata: name: lmevaljob-with-online-code-exec namespace: <your_namespace> spec: # ... allowOnline: true allowCodeExecution: true # ...The
allowOnlineandallowCodeExecutionsettings are disabled by default with a value offalsein theLMEvalJobCR. -
Deploy the LMEval Job:
$ oc apply -f lmevaljob-with-online-code-exec.yaml -n <your_namespace>
|
Important
|
If you upgrade to version 2.25, some TrustyAI |
Verification
-
Run the following command to verify that the
DataScienceClusterhas the updated fields:$ oc get datasciencecluster default-dsc -n redhat-ods-operator -o "jsonpath={.data}" -
Run the following command to verify that the
trustyai-dsc-configConfigMap has the same flag values set in theDataScienceCluster.$ oc get configmaps trustyai-dsc-config -n redhat-ods-applications -o "jsonpath={.spec.components.trustyai.eval.lmeval}"Example output{"eval.lmeval.permitCodeExecution":"true","eval.lmeval.permitOnline":"true"}
Updating LMEval job configuration using the web console
Follow these steps to enable online access (allowOnline) and remote code execution (allowCodeExecution) modes through the Open Data Hub web console for LMEval jobs.
|
Important
|
Enabling online access or code execution involves a security risk. Only use these configurations if you trust the source(s). |
Prerequisites
-
You have cluster administrator privileges for your Open Data Hub cluster.
Procedure
-
In the OpenShift Container Platform console, click Operators → Installed Operators.
-
Search for the Open Data Hub Operator, and then click the Operator name to open the Operator details page.
-
Click the Data Science Cluster tab.
-
Click the default instance name (for example, default-dsc) to open the instance details page.
-
Click the YAML tab to show the instance specifications.
-
In the
spec:components:trustyai:eval:lmevalsection, set thepermitCodeExecutionandpermitOnlinefields to a value ofallow:spec: components: trustyai: managementState: Managed eval: lmeval: permitOnline: allow permitCodeExecution: allow -
Click Save.
-
From the Project drop-down list, select the project that contains the LMEval job you are working with.
-
From the Resources drop-down list, select the
LMEvalJobinstance that you are working with. -
Click Actions → Edit YAML
-
Ensure that the
allowOnlineandallowCodeExecutionare set totrueto enable online access and code execution for this job when writing yourLMEvalJobcustom resource:apiVersion: trustyai.opendatahub.io/v1alpha1 kind: LMEvalJob metadata: name: example-lmeval spec: allowOnline: true allowCodeExecution: true -
Click Save.
| Field | Default | Description |
|---|---|---|
|
|
Enables this job to access the internet (e.g., to download datasets or tokenizers). |
|
|
Allows this job to run code included with downloaded resources. |
LM-Eval evaluation job
LM-Eval service defines a new Custom Resource Definition (CRD) called LMEvalJob. An LMEvalJob object represents an evaluation job. LMEvalJob objects are monitored by the TrustyAI Kubernetes operator.
To run an evaluation job, create an LMEvalJob object with the following information: model, model arguments, task, and secret.
|
Note
|
For a list of TrustyAI-supported tasks, see LMEval task support. |
After the LMEvalJob is created, the LM-Eval service runs the evaluation job. The status and results of the LMEvalJob object update when the information is available.
|
Note
|
Other TrustyAI features (such as bias and drift metrics) cannot be used with non-tabular models (including LLMs). Deploying the |
Sample LMEvalJob object
The sample LMEvalJob object contains the following features:
-
The
google/flan-t5-basemodel from Hugging Face. -
The dataset from the
wnlicard, a subset of the GLUE (General Language Understanding Evaluation) benchmark evaluation framework from Hugging Face. For more information about thewnliUnitxt card, see the Unitxt website. -
The following default parameters for the
multi_class.relationUnitxt task:f1_micro,f1_macro, andaccuracy. This template can be found on the Unitxt website: click Catalog, then click Tasks and select Classification from the menu.
The following is an example of an LMEvalJob object:
apiVersion: trustyai.opendatahub.io/v1alpha1
kind: LMEvalJob
metadata:
  name: evaljob-sample
spec:
  model: hf
  modelArgs:
  - name: pretrained
    value: google/flan-t5-base
  taskList:
    taskRecipes:
    - card:
        name: "cards.wnli"
      template: "templates.classification.multi_class.relation.default"
  logSamples: true
After you apply the sample LMEvalJob, check its state by using the following command:
oc get lmevaljob evaljob-sampleOutput similar to the following appears:
NAME: evaljob-sample
STATE: Running
Evaluation results are available when the state of the object changes to Complete. Both the model and dataset in this example are small. The evaluation job should finish within 10 minutes on a CPU-only node.
Use the following command to get the results:
oc get lmevaljobs.trustyai.opendatahub.io evaljob-sample \
  -o template --template={{.status.results}} | jq '.results'
The command returns results similar to the following example:
{
  "tr_0": {
    "alias": "tr_0",
    "f1_micro,none": 0.5633802816901409,
    "f1_micro_stderr,none": "N/A",
    "accuracy,none": 0.5633802816901409,
    "accuracy_stderr,none": "N/A",
    "f1_macro,none": 0.36036036036036034,
    "f1_macro_stderr,none": "N/A"
  }
}
Notes on the results
-
The
f1_micro,f1_macro, andaccuracyscores are 0.56, 0.36, and 0.56. -
The full results are stored in the
.status.resultsof theLMEvalJobobject as a JSON document. -
The command above only retrieves the results field of the JSON document.
|
Note
|
The provided |
LM-Eval evaluation job properties
The LMEvalJob object contains the following features:
-
The
google/flan-t5-basemodel. -
The dataset from the
wnlicard, from the GLUE (General Language Understanding Evaluation) benchmark evaluation framework. -
The
multi_class.relationUnitxt task default parameters.
The following table lists each property in the LMEvalJob and its usage:
| Parameter | Description |
|---|---|
|
Specifies which model type or provider is evaluated. This field directly maps to the
|
|
A list of paired name and value arguments for the model type. Arguments vary by model provider. You can find further details in the models section of the LM Evaluation Harness library on GitHub. Below are examples for some providers:
|
|
Specifies a list of tasks supported by |
|
Specifies the task using the Unitxt recipe format:
|
|
Sets the number of few-shot examples to place in context. If you are using a task from Unitxt, do not use this field. Use |
|
Set a limit to run the tasks instead of running the entire dataset. Accepts either an integer or a float between |
|
Maps to the |
|
If this flag is passed, then the model outputs and the text fed into the model are saved at per-prompt level. |
|
Specifies the batch size for the evaluation in integer format. The |
|
Specifies extra information for the
|
|
This parameter defines a custom output location to store the the evaluation results. Only Persistent Volume Claims (PVC) are supported. |
|
Creates an operator-managed PVC to store the job results. The PVC is named
|
|
Binds an existing PVC to a job by specifying its name. The PVC must be created separately and must already exist when creating the job. |
|
If this parameter is set to |
|
If this parameter is set to |
|
Mount a PVC as the local storage for models and datasets. |
|
(Optional) Sets the system instruction for all prompts passed to the evaluated model. |
|
Applies the specified chat template to prompts. Contains two fields:
* |
Properties for setting up custom Unitxt cards, templates, or system prompts
You can choose to set up custom Unitxt cards, templates, or system prompts. Use the parameters set out in the Custom Unitxt parameters table in addition to the preceding table parameters to set customized Unitxt items:
| Parameter | Description |
|---|---|
|
Defines one or more custom resources that is referenced in a task recipe. The following custom cards, templates, and system prompts are supported:
|
Performing model evaluations in the dashboard
LM-Eval is a Language Model Evaluation as a Service (LM-Eval-aaS) feature integrated into the TrustyAI Operator. It offers a unified framework for testing generative language models across a wide variety of evaluation tasks.
You can use LM-Eval through the Open Data Hub dashboard or the OpenShift CLI (oc).
These instructions are for using the dashboard.
Prerequisites
-
You have logged in to Open Data Hub with administrator privileges.
-
You have enabled the TrustyAI component, as described in Enabling the TrustyAI component.
-
You have created a project in Open Data Hub.
-
You have deployed an LLM model in your project.
|
Note
|
By default, the Develop & train → Evaluations page is hidden from the dashboard navigation menu. To show the Develop & train → Evaluations page in the dashboard, go to the |
Procedure
-
In the dashboard, click Develop & train → Evaluations. The Evaluations page opens. It contains:
-
A Start evaluation run button. If you have not run any previous evaluations, only this button is displayed.
-
A list of evaluations you have previously run, if any exist.
-
A Project dropdown option you can click to show the evaluations relating to one project instead of all projects.
-
A filter to sort your evaluations by model or evaluation name.
The following table outlines the elements and functions of the evaluations list:
-
| Property | Function |
|---|---|
Evaluation |
The name of the evaluation. |
Model |
The model that was used in the evaluation. |
Evaluated |
The date and time when the evaluation was created. |
Status |
The status of your evaluation: running, completed, or failed. |
More options icon |
Click this icon to access the options to delete the evaluation, or download the evaluation log in JSON format. |
-
From the Project dropdown menu, select the namespace of the project where you want to evaluate the model.
-
Click the Start evaluation run button. The Model evaluation form is displayed.
-
Fill in the details of the form. The model argument summary is displayed after you complete the form details:
-
Model name: Select a model from all the deployed LLMs in your project.
-
Evaluation name: Give your evaluation a unique name.
-
Tasks: Choose one or more evaluation tasks against which to measure your LLM. The 100 most common evaluation tasks are supported.
-
Model type: Choose the type of model based on the type of prompt-formatting you use:
-
Local-completion: You assemble the entire prompt chain yourself. Use this when you want to evaluate models that take a plain text prompt and return a continuation.
-
Local-chat-completion: The framework injects roles or templates automatically. Use this for models that simulate a conversation by taking a list of chat messages with roles like
userandassistantand reply appropriately.
-
-
Security settings:
-
Available online: Choose enable to allow your model to access the internet to download datasets.
-
Trust remote code: Choose enable to allow your model to trust code from outside of the project namespace.
NoteThe Security settings section is grayed out if the security option in global settings is set to
active.
-
-
-
Observe that a model argument summary is displayed as soon as you fill in the form details.
-
Complete the tokenizer settings:
-
Tokenized requests: If set to
true, the evaluation requests are broken down into tokens. If set tofalse, the evaluation dataset remains as raw text. -
Tokenizer: Type the model’s tokenizer URL that is required for the evaluations.
-
-
Click Evaluate. The screen returns to the model evaluation page of your project and your job is displayed in the evaluations list.
Note-
It can take time for your evaluation to complete, depending on factors including hardware support, model size, and the type of evaluation task(s). The status column reports the current status of the evaluation: completed, running, or failed.
-
If your evaluation fails, the evaluation pod logs in your cluster provide more information.
-
LM-Eval scenarios
The following procedures outline example scenarios that can be useful for an LM-Eval setup.
Accessing Hugging Face models with an environment variable token
If the LMEvalJob needs to access a model on HuggingFace with the access token, you can set up the HF_TOKEN as one of the environment variables for the lm-eval container.
Prerequisites
-
You have logged in to Open Data Hub.
-
Your cluster administrator has installed Open Data Hub and enabled the TrustyAI service for the project where the models are deployed.
Procedure
-
To start an evaluation job for a
huggingfacemodel, apply the following YAML file to your project through the CLI:apiVersion: trustyai.opendatahub.io/v1alpha1 kind: LMEvalJob metadata: name: evaljob-sample spec: model: hf modelArgs: - name: pretrained value: huggingfacespace/model taskList: taskNames: - unfair_tos/ logSamples: true pod: container: env: - name: HF_TOKEN value: "My HuggingFace token"For example:
$ oc apply -f <yaml_file> -n <project_name> -
(Optional) You can also create a secret to store the token, then refer the key from the
secretKeyRefobject using the following reference syntax:env: - name: HF_TOKEN valueFrom: secretKeyRef: name: my-secret key: hf-token
Using a custom Unitxt card
You can run evaluations using custom Unitxt cards. To do this, include the custom Unitxt card in JSON format within the LMEvalJob YAML.
Prerequisites
-
You have logged in to Open Data Hub.
-
Your cluster administrator has installed Open Data Hub and enabled the TrustyAI service for the project where the models are deployed.
Procedure
-
Pass a custom Unitxt Card in JSON format:
apiVersion: trustyai.opendatahub.io/v1alpha1 kind: LMEvalJob metadata: name: evaljob-sample spec: model: hf modelArgs: - name: pretrained value: google/flan-t5-base taskList: taskRecipes: - template: "templates.classification.multi_class.relation.default" card: custom: | { "__type__": "task_card", "loader": { "__type__": "load_hf", "path": "glue", "name": "wnli" }, "preprocess_steps": [ { "__type__": "split_random_mix", "mix": { "train": "train[95%]", "validation": "train[5%]", "test": "validation" } }, { "__type__": "rename", "field": "sentence1", "to_field": "text_a" }, { "__type__": "rename", "field": "sentence2", "to_field": "text_b" }, { "__type__": "map_instance_values", "mappers": { "label": { "0": "entailment", "1": "not entailment" } } }, { "__type__": "set", "fields": { "classes": [ "entailment", "not entailment" ] } }, { "__type__": "set", "fields": { "type_of_relation": "entailment" } }, { "__type__": "set", "fields": { "text_a_type": "premise" } }, { "__type__": "set", "fields": { "text_b_type": "hypothesis" } } ], "task": "tasks.classification.multi_class.relation", "templates": "templates.classification.multi_class.relation.all" } logSamples: true -
Inside the custom card specify the Hugging Face dataset loader:
"loader": { "__type__": "load_hf", "path": "glue", "name": "wnli" }, -
(Optional) You can use other Unitxt loaders (found on the Unitxt website) that contain the
volumesandvolumeMountsparameters to mount the dataset from persistent volumes. For example, if you use theLoadCSVUnitxt command, mount the files to the container and make the dataset accessible for the evaluation process.
|
Note
|
The provided scenario example does not work on |
Using PVCs as storage
To use a PVC as storage for the LMEvalJob results, you can use either managed PVCs or existing PVCs. Managed PVCs are managed by the TrustyAI operator. Existing PVCs are created by the end-user before the LMEvalJob is created.
|
Note
|
If both managed and existing PVCs are referenced in outputs, the TrustyAI operator defaults to the managed PVC. |
Prerequisites
-
You have logged in to Open Data Hub.
-
Your cluster administrator has installed Open Data Hub and enabled the TrustyAI service for the project where the models are deployed.
Managed PVCs
To create a managed PVC, specify its size. The managed PVC is named <job-name>-pvc and is available after the job finishes. When the LMEvalJob is deleted, the managed PVC is also deleted.
Procedure
-
Enter the following code:
apiVersion: trustyai.opendatahub.io/v1alpha1
kind: LMEvalJob
metadata:
  name: evaljob-sample
spec:
  # other fields omitted ...
  outputs:
    pvcManaged:
      size: 5Gi
Notes on the code
-
outputsis the section for specifying custom storage locations -
pvcManagedwill create an operator-managed PVC -
size(compatible with standard PVC syntax) is the only supported value
Existing PVCs
To use an existing PVC, pass its name as a reference. The PVC must exist when you create the LMEvalJob.
The PVC is not managed by the TrustyAI operator, so it is available after deleting the LMEvalJob.
Procedure
-
Create a PVC. An example is the following:
apiVersion: v1 kind: PersistentVolumeClaim metadata: name: "my-pvc" spec: accessModes: - ReadWriteOnce resources: requests: storage: 1Gi -
Reference the new PVC from the
LMEvalJob.apiVersion: trustyai.opendatahub.io/v1alpha1 kind: LMEvalJob metadata: name: evaljob-sample spec: # other fields omitted ... outputs: pvcName: "my-pvc"
Using a KServe Inference Service
To run an evaluation job on an InferenceService which is already deployed and running in your namespace, define your LMEvalJob CR, then apply this CR into the same namespace as your model.
NOTE
The following example only works with Hugging Face or vLLM-based model-serving runtimes.
Prerequisites
-
You have logged in to Open Data Hub.
-
Your cluster administrator has installed Open Data Hub and enabled the TrustyAI service for the project where the models are deployed.
-
You have a namespace that contains an InferenceService with a vLLM model. This example assumes that a vLLM model is already deployed in your cluster.
-
Your cluster has Domain Name System (DNS) configured.
Procedure
-
Define your
LMEvalJobCR:apiVersion: trustyai.opendatahub.io/v1alpha1 kind: LMEvalJob metadata: name: evaljob spec: model: local-completions taskList: taskNames: - mmlu logSamples: true batchSize: 1 modelArgs: - name: model value: granite - name: base_url value: $ROUTE_TO_MODEL/v1/completions - name: num_concurrent value: "1" - name: max_retries value: "3" - name: tokenized_requests value: false - name: tokenizer value: huggingfacespace/model env: - name: OPENAI_TOKEN valueFrom: secretKeyRef: name: <secret-name> key: token -
Apply this CR into the same namespace as your model.
Verification
A pod spins up in your model namespace called evaljob. In the pod terminal, you can see the output via tail -f output/stderr.log.
Notes on the code
-
base_urlshould be set to the route/service URL of your model. Make sure to include the/v1/completionsendpoint in the URL. -
env.valueFrom.secretKeyRef.nameshould point to a secret that contains a token that can authenticate to your model.secretRef.nameshould be the secret’s name in the namespace, whilesecretRef.keyshould point at the token’s key within the secret. -
secretKeyRef.namecan equal the output of:oc get secrets -o custom-columns=SECRET:.metadata.name --no-headers | grep user-one-token -
secretKeyRef.keyis set totoken
Setting up LM-Eval S3 Support
Learn how to set up S3 support for your LM-Eval service.
Prerequisites
-
You have logged in to Open Data Hub.
-
Your cluster administrator has installed Open Data Hub and enabled the TrustyAI service for the project where the models are deployed.
-
You have a namespace that contains an S3-compatible storage service and bucket.
-
You have created an
LMEvalJobthat references the S3 bucket containing your model and dataset. -
You have an S3 bucket that contains the model files and the dataset(s) to be evaluated.
Procedure
-
Create a Kubernetes Secret containing your S3 connection details:
apiVersion: v1 kind: Secret metadata: name: "s3-secret" namespace: test labels: opendatahub.io/dashboard: "true" opendatahub.io/managed: "true" annotations: opendatahub.io/connection-type: s3 openshift.io/display-name: "S3 Data Connection - LMEval" data: AWS_ACCESS_KEY_ID: BASE64_ENCODED_ACCESS_KEY # Replace with your key AWS_SECRET_ACCESS_KEY: BASE64_ENCODED_SECRET_KEY # Replace with your key AWS_S3_BUCKET: BASE64_ENCODED_BUCKET_NAME # Replace with your bucket name AWS_S3_ENDPOINT: BASE64_ENCODED_ENDPOINT # Replace with your endpoint URL (for example, https://s3.amazonaws.com) AWS_DEFAULT_REGION: BASE64_ENCODED_REGION # Replace with your region type: OpaqueNoteAll values must be
base64encoded. For example:echo -n "my-bucket" | base64 -
Deploy the
LMEvalJobCR that references the S3 bucket containing your model and dataset:apiVersion: trustyai.opendatahub.io/v1alpha1 kind: LMEvalJob metadata: name: evaljob-sample spec: allowOnline: false model: hf # Model type (HuggingFace in this example) modelArgs: - name: pretrained value: /opt/app-root/src/hf_home/flan # Path where model is mounted in container taskList: taskNames: - arc_easy # The evaluation task to run logSamples: true offline: storage: s3: accessKeyId: name: s3-secret key: AWS_ACCESS_KEY_ID secretAccessKey: name: s3-secret key: AWS_SECRET_ACCESS_KEY bucket: name: s3-secret key: AWS_S3_BUCKET endpoint: name: s3-secret key: AWS_S3_ENDPOINT region: name: s3-secret key: AWS_DEFAULT_REGION path: "" # Optional subfolder within bucket verifySSL: falseImportantThe `LMEvalJob` will copy all the files from the specified bucket/path. If your bucket contains many files and you only want to use a subset, set the `path` field to the specific sub-folder containing the files that you require. For example use `path: "my-models/"`.
-
Set up a secure connection using SSL.
-
Create a ConfigMap object with your CA certificate:
apiVersion: v1 kind: ConfigMap metadata: name: s3-ca-cert namespace: test annotations: service.beta.openshift.io/inject-cabundle: "true" # For injection data: {} # OpenShift will inject the service CA bundle # Or add your custom CA: # data: # ca.crt: |- # -----BEGIN CERTIFICATE----- # ...your CA certificate content... # -----END CERTIFICATE----- -
Update the
LMEvalJobto use SSL verification:apiVersion: trustyai.opendatahub.io/v1alpha1 kind: LMEvalJob metadata: name: evaljob-sample spec: # ... same as above ... offline: storage: s3: # ... same as above ... verifySSL: true # Enable SSL verification caBundle: name: s3-ca-cert # ConfigMap name containing your CA key: service-ca.crt # Key in ConfigMap containing the certificate
-
Verification
-
After deploying the
LMEvalJob, open thekubectlcommand-line and enter this command to check its status:kubectl logs -n test job/evaljob-sample -n test -
View the logs with the
kubectlcommandkubectl logs -n test job/<job-name>to make sure it has functioned correctly. -
The results are displayed in the logs after the evaluation is completed.
Using LLM-as-a-Judge metrics with LM-Eval
You can use a large language model (LLM) to assess the quality of outputs from another LLM, known as LLM-as-a-Judge (LLMaaJ).
You can use LLMaaJ to:
-
Assess work with no clearly correct answer, such as creative writing.
-
Judge quality characteristics such as helpfulness, safety, and depth.
-
Augment traditional quantitative measures that are used to evaluate a model’s performance (for example,
ROUGEmetrics). -
Test specific quality aspects of your model output.
Follow the custom quality assessment example below to learn more about using your own metrics criteria with LM-Eval to evaluate model responses.
This example uses Unitxt to define custom metrics and to see how the model (flan-t5-small) answers questions from MT-Bench, a standard benchmark. Custom evaluation criteria and instructions from the Mistral-7B model are used to rate the answers from 1-10, based on helpfulness, accuracy, and detail.
Prerequisites
-
You have logged in to Open Data Hub.
-
You have installed the OpenShift CLI (
oc) as described in the appropriate documentation for your cluster:-
Installing the OpenShift CLI for OpenShift Container Platform
-
Installing the OpenShift CLI for Red Hat OpenShift Service on AWS
-
-
Your cluster administrator has installed Open Data Hub and enabled the TrustyAI service for the project where the models are deployed.
-
You are familiar with how to use Unitxt.
-
You have set the following parameters:
Table 6. Parameters Parameter Description Custom template
Tells the judge to assign a score between 1 and 10 in a standardized format, based on specific criteria.
processors.extract_mt_bench_rating_judgmentPulls the numerical rating from the judge’s response.
formats.models.mistral.instructionFormats the prompts for the Mistral model.
Custom LLM-as-judge metric
Uses Mistral-7B with your custom instructions.
Procedure
-
In a terminal window, if you are not already logged in to your OpenShift cluster as a cluster administrator, log in to the OpenShift CLI (
oc) as shown in the following example:$ oc login <openshift_cluster_url> -u <admin_username> -p <password> -
Apply the following manifest by using the
oc apply -f -command. The YAML content defines a custom evaluation job (LMEvalJob), the namespace, and the location of the model you want to evaluate. The YAML contains the following instructions:-
Which model to evaluate.
-
What data to use.
-
How to format inputs and outputs.
-
Which judge model to use.
-
How to extract and log results.
NoteYou can also put the YAML manifest into a file using a text editor and then apply it by using the
oc apply -f file.yamlcommand.
-
apiVersion: trustyai.opendatahub.io/v1alpha1
kind: LMEvalJob
metadata:
 name: custom-eval
 namespace: test
spec:
 allowOnline: true
 allowCodeExecution: true
 model: hf
 modelArgs:
   - name: pretrained
     value: google/flan-t5-small
taskList:
 taskRecipes:
     - card:
         custom: |
           {
               "__type__": "task_card",
               "loader": {
                   "__type__": "load_hf",
                   "path": "OfirArviv/mt_bench_single_score_gpt4_judgement",
                   "split": "train"
               },
               "preprocess_steps": [
                   {
                       "__type__": "rename_splits",
                       "mapper": {
                           "train": "test"
                       }
                   },
                   {
                       "__type__": "filter_by_condition",
                       "values": {
                           "turn": 1
                       },
                       "condition": "eq"
                   },
                   {
                       "__type__": "filter_by_condition",
                       "values": {
                           "reference": "[]"
                       },
                       "condition": "eq"
                   },
                   {
                       "__type__": "rename",
                       "field_to_field": {
                           "model_input": "question",
                           "score": "rating",
                           "category": "group",
                           "model_output": "answer"
                       }
                   },
                   {
                       "__type__": "literal_eval",
                       "field": "question"
                   },
                   {
                       "__type__": "copy",
                       "field": "question/0",
                       "to_field": "question"
                   },
                   {
                       "__type__": "literal_eval",
                       "field": "answer"
                   },
                   {
                       "__type__": "copy",
                       "field": "answer/0",
                       "to_field": "answer"
                   }
               ],
               "task": "tasks.response_assessment.rating.single_turn",
               "templates": [
                   "templates.response_assessment.rating.mt_bench_single_turn"
               ]
           }
       template:
         ref: response_assessment.rating.mt_bench_single_turn
       format: formats.models.mistral.instruction
       metrics:
       - ref: llmaaj_metric
   custom:
     templates:
       - name: response_assessment.rating.mt_bench_single_turn
         value: |
           {
               "__type__": "input_output_template",
               "instruction": "Please act as an impartial judge and evaluate the quality of the response provided by an AI assistant to the user question displayed below. Your evaluation should consider factors such as the helpfulness, relevance, accuracy, depth, creativity, and level of detail of the response. Begin your evaluation by providing a short explanation. Be as objective as possible. After providing your explanation, you must rate the response on a scale of 1 to 10 by strictly following this format: \"[[rating]]\", for example: \"Rating: [[5]]\".\n\n",
               "input_format": "[Question]\n{question}\n\n[The Start of Assistant's Answer]\n{answer}\n[The End of Assistant's Answer]",
               "output_format": "[[{rating}]]",
               "postprocessors": [
                   "processors.extract_mt_bench_rating_judgment"
               ]
           }
     tasks:
       - name: response_assessment.rating.single_turn
         value: |
           {
               "__type__": "task",
               "input_fields": {
                   "question": "str",
                   "answer": "str"
               },
               "outputs": {
                   "rating": "float"
               },
               "metrics": [
                   "metrics.spearman"
               ]
           }
     metrics:
       - name: llmaaj_metric
         value: |
           {
               "__type__": "llm_as_judge",
               "inference_model": {
                   "__type__": "hf_pipeline_based_inference_engine",
                   "model_name": "mistralai/Mistral-7B-Instruct-v0.2",
                   "max_new_tokens": 256,
                   "use_fp16": true
               },
               "template": "templates.response_assessment.rating.mt_bench_single_turn",
               "task": "rating.single_turn",
               "format": "formats.models.mistral.instruction",
               "main_score": "mistral_7b_instruct_v0_2_huggingface_template_mt_bench_single_turn"
           }
 logSamples: true
 pod:
   container:
     env:
       - name: HF_TOKEN
         valueFrom:
           secretKeyRef:
             name: hf-token-secret
             key: token
     resources:
       limits:
         cpu: '2'
         memory: 16Gi
Verification
A processor extracts the numeric rating from the judge’s natural language response. The final result is available as part of the LMEval Job Custom Resource (CR).
|
Note
|
The provided scenario example does not work for |
Evaluating RAG systems with Ragas
As an AI engineer, you can use Retrieval-Augmented Generation Assessment (Ragas) to measure and improve the quality of your RAG systems in Open Data Hub. Ragas provides objective metrics that assess retrieval quality, answer relevance, and factual consistency, enabling you to identify issues, optimize configurations, and establish automated quality gates in your development workflows.
Ragas is integrated with Open Data Hub through the Llama Stack evaluation API and supports two deployment modes: an inline provider for development and testing, and a remote provider for production-scale evaluations using Open Data Hub pipelines.
About Ragas evaluation
Ragas addresses the unique challenges of evaluating RAG systems by providing metrics that assess both the retrieval and generation components of your application. Unlike traditional language model evaluation that focuses solely on output quality, Ragas evaluates how well your system retrieves relevant context and generates responses grounded in that context.
Key Ragas metrics
Ragas provides multiple metrics for evaluating RAG systems. Here are some of the metrics:
- Faithfulness
-
Measures the generated answer to determine whether it is consistent with the retrieved context. A high faithfulness score indicates that the answer is well-grounded in the source documents, reducing the risk of hallucinations. This is critical for enterprise and regulated environments where accuracy and trustworthiness are paramount.
- Answer Relevancy
-
Evaluates whether the generated answer is consistent with the input question. This metric ensures that your RAG system provides pertinent responses rather than generic or off-topic information.
- Context Precision
-
Measures the precision of the retrieval component by evaluating whether the retrieved context chunks contain information relevant to answering the question. High precision indicates that your retrieval system is returning focused, relevant documents rather than irrelevant noise.
- Context Recall
-
Measures the recall of the retrieval component by evaluating whether all necessary information for answering the question is present in the retrieved contexts. High recall ensures that your retrieval system is not missing important information.
- Answer Correctness
-
Compares the generated answer with a ground truth reference answer to measure accuracy. This metric is useful when you have labeled evaluation datasets with known correct answers.
- Answer Similarity
-
Measures the semantic similarity between the generated answer and a reference answer, providing a more nuanced assessment than exact string matching.
Use cases for Ragas in AI engineering workflows
Ragas enables AI engineers to accomplish the following tasks:
- Automate quality checks
-
Create reproducible, objective evaluation jobs that can be automatically triggered after every code commit or model update. Automatic quality checks establish quality gates to prevent regressions and ensure that you deploy only high-quality RAG configurations to production.
- Enable evaluation-driven development (EDD)
-
Use Ragas metrics to guide iterative optimization. For example, test different chunking strategies, embedding models, or retrieval algorithms against a defined benchmark. You can discover the optimal RAG configuration that maximizes performance metrics. For example, you can maximize faithfulness while minimizing computational cost.
- Ensure factual consistency and trustworthiness
-
Measure the reliability of your RAG system by setting thresholds on metrics like faithfulness. Metrics thresholds ensure that responses are consistently grounded in source documents, which is critical for enterprise applications where hallucinations or factual errors are unacceptable.
- Achieve production scalability
-
Leverage the remote provider pattern with Open Data Hub pipelines to execute evaluations as distributed jobs. The remote provider pattern allows you to run large-scale benchmarks across thousands of data points without blocking development or consuming excessive local resources.
- Compare model and configuration variants
-
Run comparative evaluations across different models, retrieval strategies, or system configurations to make data-driven decisions about your RAG architecture. For example, compare the impact of different chunk sizes (512 vs 1024 tokens) or different embedding models on retrieval quality metrics.
Ragas provider deployment modes
Open Data Hub supports two deployment modes for Ragas evaluation:
- Inline provider
-
The inline provider mode runs Ragas evaluation in the same process as the Llama Stack server. Use the inline provider for development and rapid prototyping. It offers the following advantages:
-
Fast processing with in-memory operations
-
Minimal configuration overhead
-
Local development and testing
-
Evaluation of small to medium-sized datasets
-
- Remote provider
-
The remote provider mode runs Ragas evaluation as distributed jobs using Open Data Hub pipelines (powered by Kubeflow Pipelines). Use the remote provider for production environments. It offers the following capabilities:
-
Running evaluations in parallel across thousands of data points
-
Providing resource isolation and management
-
Integrating with CI/CD pipelines for automated quality gates
-
Storing results in S3-compatible object storage
-
Tracking evaluation history and metrics over time
-
Supporting large-scale batch evaluations without impacting the Llama Stack server
-
Setting up the Ragas inline provider for development
You can set up the Ragas inline provider to run evaluations directly within the Llama Stack server process. The inline provider is ideal for development environments, rapid prototyping, and lightweight evaluation workloads where simplicity and quick iteration are priorities.
Prerequisites
-
You have cluster administrator privileges for your OpenShift Container Platform cluster.
-
You have installed the OpenShift CLI (
oc) as described in the appropriate documentation for your cluster:-
Installing the OpenShift CLI for OpenShift Container Platform
-
Installing the OpenShift CLI for Red Hat OpenShift Service on AWS
-
-
You have activated the Llama Stack Operator in Open Data Hub. For more information, see Installing the Llama Stack Operator.
-
You have deployed a Llama model with KServe. For more information, see Deploying a Llama model with KServe.
-
You have created a project.
Procedure
-
In a terminal window, if you are not already logged in to your OpenShift cluster, log in to the OpenShift CLI (
oc) as shown in the following example:$ oc login <openshift_cluster_url> -u <username> -p <password> -
Navigate to your project:
$ oc project <project_name> -
Create a ConfigMap for the Ragas inline provider configuration. For example, create a
ragas-inline-config.yamlfile as follows:Exampleragas-inline-config.yamlapiVersion: v1 kind: ConfigMap metadata: name: ragas-inline-config namespace: <project_name> data: EMBEDDING_MODEL: "all-MiniLM-L6-v2"-
EMBEDDING_MODEL: Used by Ragas for semantic similarity calculations. Theall-MiniLM-L6-v2model is a lightweight, efficient option suitable for most use cases.
-
-
Apply the ConfigMap:
$ oc apply -f ragas-inline-config.yaml -
Create a Llama Stack distribution configuration file with the Ragas inline provider. For example, create a
llama-stack-ragas-inline.yamlfile as follows:Examplellama-stack-ragas-inline.yamlapiVersion: llamastack.trustyai.opendatahub.io/v1alpha1 kind: LlamaStackDistribution metadata: name: llama-stack-ragas-inline namespace: <project_name> spec: replicas: 1 server: containerSpec: env: # ... - name: VLLM_URL value: <model_url> - name: VLLM_API_TOKEN value: <model_api_token (if necessary)> - name: INFERENCE_MODEL value: <model_name> - name: MILVUS_DB_PATH value: ~/.llama/milvus.db - name: VLLM_TLS_VERIFY value: "false" - name: FMS_ORCHESTRATOR_URL value: http://localhost:123 - name: EMBEDDING_MODEL value: granite-embedding-125m # ... -
Deploy the Llama Stack distribution:
$ oc apply -f llama-stack-ragas-inline.yaml -
Wait for the deployment to complete:
$ oc get pods -wWait until the
llama-stack-ragas-inlinepod status showsRunning.
Configuring the Ragas remote provider for production
You can configure the Ragas remote provider to run evaluations as distributed jobs using Open Data Hub pipelines. The remote provider enables production-scale evaluations by running Ragas in a separate Kubeflow Pipelines environment, providing resource isolation, improved scalability, and integration with CI/CD workflows.
Prerequisites
-
You have cluster administrator privileges for your OpenShift Container Platform cluster.
-
You have installed the Open Data Hub Operator.
-
You have a
DataScienceClustercustom resource in your environment; in thespec.componentssection thellamastackoperator.managementStateis enabled with a value ofManaged. -
You have installed the OpenShift CLI (
oc) as described in the appropriate documentation for your cluster:-
Installing the OpenShift CLI for OpenShift Container Platform
-
Installing the OpenShift CLI for Red Hat OpenShift Service on AWS
-
-
You have configured a pipeline server in your project. For more information, see Configuring a pipeline server.
-
You have activated the Llama Stack Operator in Open Data Hub. For more information, see Installing the Llama Stack Operator.
-
You have deployed a Large Language Model with KServe. For more information, see Deploying a Llama model with KServe.
-
You have configured S3-compatible object storage for storing evaluation results and you know your S3 credentials: AWS access key, AWS secret access key, and AWS default region. For more information, see Adding a connection to your project.
-
You have created a project.
Procedure
-
In a terminal window, if you are not already logged in to your OpenShift cluster, log in to the OpenShift CLI (
oc) as shown in the following example:$ oc login <openshift_cluster_url> -u <username> -p <password> -
Navigate to your project:
$ oc project <project_name> -
Create a secret for storing S3 credentials:
$ oc create secret generic "<ragas_s3_credentials>" \ --from-literal=AWS_ACCESS_KEY_ID=<your_access_key> \ --from-literal=AWS_SECRET_ACCESS_KEY=<your_secret_key> \ --from-literal=AWS_DEFAULT_REGION=<your_region>ImportantReplace the placeholder values with your actual S3 credentials. These AWS credentials are required in two locations:
-
In the Llama Stack server pod (as environment variables) - to access S3 when creating pipeline runs.
-
In the Kubeflow Pipeline pods (via the secret) - to store evaluation results to S3 during pipeline execution.
The LlamaStackDistribution configuration loads these credentials from the
"<ragas_s3_credentials>"secret and makes them available to both locations. -
-
Create a secret for the Kubeflow Pipelines API token:
-
Get your token by running the following command:
$ export KUBEFLOW_PIPELINES_TOKEN=$(oc whoami -t) -
Create the secret by running the following command:
$ oc create secret generic kubeflow-pipelines-token \ --from-literal=KUBEFLOW_PIPELINES_TOKEN="$KUBEFLOW_PIPELINES_TOKEN"ImportantThe Llama Stack distribution service account does not have privileges to create pipeline runs. This secret provides the necessary authentication token for creating and managing pipeline runs.
-
-
Verify that the Kubeflow Pipelines endpoint is accessible:
$ curl -k -H "Authorization: Bearer $KUBEFLOW_PIPELINES_TOKEN" \ https://$KUBEFLOW_PIPELINES_ENDPOINT/apis/v1beta1/healthz -
Create a secret for storing your inference model information:
$ export INFERENCE_MODEL="llama-3-2-3b" $ export VLLM_URL="https://llama-32-3b-instruct-predictor:8443/v1" $ export VLLM_TLS_VERIFY="false" # Use "true" in production $ export VLLM_API_TOKEN="<token_identifier>" $ oc create secret generic llama-stack-inference-model-secret \ --from-literal INFERENCE_MODEL="$INFERENCE_MODEL" \ --from-literal VLLM_URL="$VLLM_URL" \ --from-literal VLLM_TLS_VERIFY="$VLLM_TLS_VERIFY" \ --from-literal VLLM_API_TOKEN="$VLLM_API_TOKEN" -
Get the Kubeflow Pipelines endpoint by running the following command and searching for "pipeline" in the routes. This is used in a later step for creating a ConfigMap for the Ragas remote provider configuration:
$ oc get routes -A | grep -i pipelineThis output should show that the namespace, which is the namespace you specified for
KUBEFLOW_NAMESPACE, has the pipeline server endpoint and the associated metadata one. The one to use isds-pipeline-dspa. -
Create a ConfigMap for the Ragas remote provider configuration. For example, create a
kubeflow-ragas-config.yamlfile as follows:Example kubeflow-ragas-config.yamlapiVersion: v1 kind: ConfigMap metadata: name: kubeflow-ragas-config namespace: <project_name> data: EMBEDDING_MODEL: "all-MiniLM-L6-v2" KUBEFLOW_LLAMA_STACK_URL: "http://$<distribution_name>-service.$<your_namespace>.svc.cluster.local:$<port>" KUBEFLOW_PIPELINES_ENDPOINT: "https://<kfp_endpoint>" KUBEFLOW_NAMESPACE: "<project_name>" KUBEFLOW_BASE_IMAGE: "quay.io/rhoai/odh-trustyai-ragas-lls-provider-dsp-rhel9:rhoai-3.0" KUBEFLOW_RESULTS_S3_PREFIX: "s3://<bucket_name>/ragas-results" KUBEFLOW_S3_CREDENTIALS_SECRET_NAME: "<ragas_s3_credentials>"-
EMBEDDING_MODEL: Used by Ragas for semantic similarity calculations. -
KUBEFLOW_LLAMA_STACK_URL: The URL for the Llama Stack server. This must be accessible from the Kubeflow Pipeline pods. The <distribution_name>, <namespace>, and <port> are replaced with the name of the LlamaStack distribution you are creating, the namespace where you are creating it, and the port. These 3 elements are present in the LlamaStack distribution YAML. -
KUBEFLOW_PIPELINES_ENDPOINT: The Kubeflow Pipelines API endpoint URL. -
KUBEFLOW_NAMESPACE: The namespace where pipeline runs are executed. This should match your current project namespace. -
KUBEFLOW_BASE_IMAGE: The container image used for Ragas evaluation pipeline components. This image contains the Ragas provider package installed via pip. -
KUBEFLOW_RESULTS_S3_PREFIX: The S3 path prefix where evaluation results are stored. For example:s3://my-bucket/ragas-evaluation-results. -
KUBEFLOW_S3_CREDENTIALS_SECRET_NAME: The name of the secret containing S3 credentials.
-
-
Apply the ConfigMap:
$ oc apply -f kubeflow-ragas-config.yaml -
Create a Llama Stack distribution configuration file with the Ragas remote provider. For example, create a llama-stack-ragas-remote.yaml as follows:
Example llama-stack-ragas-remote.yamlapiVersion: llamastack.io/v1alpha1 kind: LlamaStackDistribution metadata: name: llama-stack-pod spec: replicas: 1 server: containerSpec: resources: requests: cpu: 4 memory: "12Gi" limits: cpu: 6 memory: "14Gi" env: - name: INFERENCE_MODEL valueFrom: secretKeyRef: key: INFERENCE_MODEL name: llama-stack-inference-model-secret optional: true - name: VLLM_MAX_TOKENS value: "4096" - name: VLLM_URL valueFrom: secretKeyRef: key: VLLM_URL name: llama-stack-inference-model-secret optional: true - name: VLLM_TLS_VERIFY valueFrom: secretKeyRef: key: VLLM_TLS_VERIFY name: llama-stack-inference-model-secret optional: true - name: VLLM_API_TOKEN valueFrom: secretKeyRef: key: VLLM_API_TOKEN name: llama-stack-inference-model-secret optional: true - name: MILVUS_DB_PATH value: ~/milvus.db - name: FMS_ORCHESTRATOR_URL value: "http://localhost" - name: KUBEFLOW_PIPELINES_ENDPOINT valueFrom: configMapKeyRef: key: KUBEFLOW_PIPELINES_ENDPOINT name: kubeflow-ragas-config optional: true - name: KUBEFLOW_NAMESPACE valueFrom: configMapKeyRef: key: KUBEFLOW_NAMESPACE name: kubeflow-ragas-config optional: true - name: KUBEFLOW_BASE_IMAGE valueFrom: configMapKeyRef: key: KUBEFLOW_BASE_IMAGE name: kubeflow-ragas-config optional: true - name: KUBEFLOW_LLAMA_STACK_URL valueFrom: configMapKeyRef: key: KUBEFLOW_LLAMA_STACK_URL name: kubeflow-ragas-config optional: true - name: KUBEFLOW_RESULTS_S3_PREFIX valueFrom: configMapKeyRef: key: KUBEFLOW_RESULTS_S3_PREFIX name: kubeflow-ragas-config optional: true - name: KUBEFLOW_S3_CREDENTIALS_SECRET_NAME valueFrom: configMapKeyRef: key: KUBEFLOW_S3_CREDENTIALS_SECRET_NAME name: kubeflow-ragas-config optional: true - name: EMBEDDING_MODEL valueFrom: configMapKeyRef: key: EMBEDDING_MODEL name: kubeflow-ragas-config optional: true - name: KUBEFLOW_PIPELINES_TOKEN valueFrom: secretKeyRef: key: KUBEFLOW_PIPELINES_TOKEN name: kubeflow-pipelines-token optional: true - name: AWS_ACCESS_KEY_ID valueFrom: secretKeyRef: key: AWS_ACCESS_KEY_ID name: "<ragas_s3_credentials>" optional: true - name: AWS_SECRET_ACCESS_KEY valueFrom: secretKeyRef: key: AWS_SECRET_ACCESS_KEY name: "<ragas_s3_credentials>" optional: true - name: AWS_DEFAULT_REGION valueFrom: secretKeyRef: key: AWS_DEFAULT_REGION name: "<ragas_s3_credentials>" optional: true name: llama-stack port: 8321 distribution: name: rh-dev -
Deploy the Llama Stack distribution:
$ oc apply -f llama-stack-ragas-remote.yaml -
Wait for the deployment to complete:
$ oc get pods -wWait until the
llama-stack-podpod status showsRunning.
Evaluating RAG system quality with Ragas metrics
Evaluate your RAG system quality by testing your setup, using the example provided in the demo notebook. This demo outlines the basic steps for evaluating your RAG system with Ragas using the Python client. You can execute the demo notebook steps from a Jupyter environment.
Alternatively, you can submit an evaluation by directly using the http methods of the Llama Stack API.
|
Important
|
The Llama Stack pod must be accessible from the Jupyter environment in the cluster, which may not be the case by default. To configure this setup, see Ingesting content into a Llama model |
Prerequisites
-
You have logged in to Open Data Hub.
-
You have created a project.
-
You have created a pipeline server.
-
You have created a secret for your AWS credentials in your project namespace.
-
You have deployed a Llama Stack distribution with the Ragas evaluation provider enabled (Inline or Remote). For more information, see Configuring the Ragas remote provider for production.
-
You have access to a workbench or notebook environment where you can run Python code.
Procedure
-
From the Open Data Hub dashboard, click Projects.
-
Click the name of the project that contains the workbench.
-
Click the Workbenches tab.
-
If the status of the workbench is Running, skip to the next step.
If the status of the workbench is Stopped, in the Status column for the workbench, click Start.
The Status column changes from Stopped to Starting when the workbench server is starting, and then to Running when the workbench has successfully started.
-
Click the open icon (
 ) next to the workbench.
Your Jupyter environment window opens.
-
On the toolbar, click the Git Clone icon and then select Clone a Repository.
-
In the Clone a repo dialog, enter the following URL
https://github.com/trustyai-explainability/llama-stack-provider-ragas.git -
In the file browser, select the newly-created
/llama-stack-provider-ragas/demosfolder.You see a Jupyter notebook named
basic_demo.ipynb. -
Double-click the
basic_demo.ipynbfile to launch the Jupyter notebook.The Jupyter notebook opens. You see code examples for the following tasks:
-
Run your Llama Stack distribution
-
Setup and Imports
-
Llama Stack Client Setup
-
Dataset Preparation
-
Dataset Registration
-
Benchmark Registration
-
Evaluation Execution
-
Inline vs Remote Side-by-side
-
-
In the Jupyter notebook, run the code cells sequentially through the Evaluation Execution.
-
Return to the Open Data Hub dashboard.
-
Click Develop & train → Pipelines → Runs. You might need to refresh the page to see that the new evaluation job running.
-
Wait for the job to show Successful.
-
Return to the workbench and run the Results Display cell.
-
Inspect the results displayed.
Using llama stack with TrustyAI
This section contains tutorials for working with Llama Stack in TrustyAI. These tutorials demonstrate how to use various Llama Stack components and providers to evaluate and work with language models.
The following sections describe how to work with Llama Stack and provide example use cases:
-
Using the Llama Stack external evaluation provider with lm-evaluation-harness in TrustyAI
-
Running custom evaluations with LM-Eval Llama Stack external evaluation provider
-
Using the trustyai-fms Guardrails Orchestrator with Llama Stack
Using Llama Stack external evaluation provider with lm-evaluation-harness in TrustyAI
This example demonstrates how to evaluate a language model in Open Data Hub using the LMEval Llama Stack external eval provider in a Python workbench. To do this, configure a Llama Stack server to use the LMEval eval provider, register a benchmark dataset, and run a benchmark evaluation job on a language model.
Prerequisites
-
You have installed Open Data Hub, version 2.29 or later.
-
You have cluster administrator privileges for your Open Data Hub cluster.
-
You have installed the OpenShift CLI (
oc) as described in the appropriate documentation for your cluster:-
Installing the OpenShift CLI for OpenShift Container Platform
-
Installing the OpenShift CLI for Red Hat OpenShift Service on AWS
-
-
You have a large language model (LLM) for chat generation or text classification, or both, deployed in your namespace.
-
You have installed TrustyAI Operator in your Open Data Hub cluster.
-
You have set KServe to Raw Deployment mode in your cluster.
Procedure
-
Create and activate a Python virtual environment for this tutorial in your local machine:
python3 -m venv .venv source .venv/bin/activate -
Install the required packages from the Python Package Index (PyPI):
pip install \ llama-stack \ llama-stack-client \ llama-stack-provider-lmeval -
Create the model route:
oc create route edge vllm --service=<VLLM_SERVICE> --port=<VLLM_PORT> -n <MODEL_NAMESPACE> -
Configure the Llama Stack server. Set the variables to configure the runtime endpoint and namespace. The VLLM_URL value should be the
v1/completionsendpoint of your model route and the TRUSTYAI_LM_EVAL_NAMESPACE should be the namespace where your model is deployed. For example:export TRUSTYAI_LM_EVAL_NAMESPACE=<MODEL_NAMESPACE> export MODEL_ROUTE=$(oc get route -n "$TRUSTYAI_LM_EVAL_NAMESPACE" | awk '/predictor/{print $2; exit}') export VLLM_URL="https://${MODEL_ROUTE}/v1/completions" -
Download the
providers.dprovider configuration directory and therun.yamlexecution file:curl --create-dirs --output providers.d/remote/eval/trustyai_lmeval.yaml https://raw.githubusercontent.com/trustyai-explainability/llama-stack-provider-lmeval/refs/heads/main/providers.d/remote/eval/trustyai_lmeval.yaml curl --create-dirs --output run.yaml https://raw.githubusercontent.com/trustyai-explainability/llama-stack-provider-lmeval/refs/heads/main/run.yaml -
Start the Llama Stack server in a virtual environment, which uses port
8321by default:llama stack run run.yaml --image-type venv -
Create a Python script in a Jupyter workbench and import the following libraries and modules, to interact with the server and run an evaluation:
import os import subprocess import logging import time import pprint -
Start the Llama Stack Python client to interact with the running Llama Stack server:
BASE_URL = "http://localhost:8321" def create_http_client(): from llama_stack_client import LlamaStackClient return LlamaStackClient(base_url=BASE_URL) client = create_http_client() -
Print a list of the current available benchmarks:
benchmarks = client.benchmarks.list() pprint.pprint(f"Available benchmarks: {benchmarks}") -
LMEval provides access to over 100 preconfigured evaluation datasets. Register the ARC-Easy benchmark, a dataset of grade-school level, multiple-choice science questions:
client.benchmarks.register( benchmark_id="trustyai_lmeval::arc_easy", dataset_id="trustyai_lmeval::arc_easy", scoring_functions=["string"], provider_benchmark_id="string", provider_id="trustyai_lmeval", metadata={ "tokenizer": "google/flan-t5-small", "tokenized_requests": False, } ) -
Verify that the benchmark has been registered successfully:
benchmarks = client.benchmarks.list() pprint.print(f"Available benchmarks: {benchmarks}") -
Run a benchmark evaluation job on your deployed model using the following input. Replace phi-3 with the name of your deployed model:
job = client.eval.run_eval( benchmark_id="trustyai_lmeval::arc_easy", benchmark_config={ "eval_candidate": { "type": "model", "model": "phi-3", "provider_id": "trustyai_lmeval", "sampling_params": { "temperature": 0.7, "top_p": 0.9, "max_tokens": 256 }, }, "num_examples": 1000, }, ) print(f"Starting job '{job.job_id}'") -
Monitor the status of the evaluation job using the following code. The job will run asynchronously, so you can check its status periodically:
def get_job_status(job_id, benchmark_id):
    return client.eval.jobs.status(job_id=job_id, benchmark_id=benchmark_id)

while True:
    job = get_job_status(job_id=job.job_id, benchmark_id="trustyai_lmeval::arc_easy")
    print(job)

    if job.status in ['failed', 'completed']:
        print(f"Job ended with status: {job.status}")
        break

    time.sleep(20)
-
Retrieve the evaluation job results once the job status reports back as
completed:pprint.pprint(client.eval.jobs.retrieve(job_id=job.job_id, benchmark_id="trustyai_lmeval::arc_easy").scores)
Running custom evaluations with LM-Eval and Llama Stack
This example demonstrates how to use the LM-Eval Llama Stack external eval provider to evaluate a language model with a custom benchmark. Creating a custom benchmark is useful for evaluating specific model knowledge and behavior.
The process involves three steps:
-
Uploading the task dataset to your Open Data Hub cluster
-
Registering it as a custom benchmark dataset with Llama Stack
-
Running a benchmark evaluation job on a language model
Prerequisites
-
You have installed Open Data Hub, version 2.29 or later.
-
You have cluster administrator privileges for your Open Data Hub cluster.
-
You have installed the OpenShift CLI (
oc) as described in the appropriate documentation for your cluster:-
Installing the OpenShift CLI for OpenShift Container Platform
-
Installing the OpenShift CLI for Red Hat OpenShift Service on AWS
-
-
You have a large language model (LLM) for chat generation or text classification, or both, deployed on vLLM Serving Runtime in your Open Data Hub cluster.
-
You have installed TrustyAI Operator in your Open Data Hub cluster.
-
You have set KServe to Raw Deployment mode in your cluster.
Procedure
-
Upload your custom benchmark dataset to your OpenShift cluster using a PersistentVolumeClaim (PVC) and a temporary pod. Create a PVC named
my-pvcto store your dataset. Run the following command in your CLI, replacing <MODEL_NAMESPACE> with the namespace of your language model:oc apply -n <MODEL_NAMESPACE> -f - << EOF apiVersion: v1 kind: PersistentVolumeClaim metadata: name: my-pvc spec: accessModes: - ReadWriteOnce resources: requests: storage: 5Gi EOF -
Create a pod object named
dataset-storage-podto download the task dataset into the PVC. This pod is used to copy your dataset from your local machine to the Open Data Hub cluster:oc apply -n <MODEL_NAMESPACE> -f - << EOF apiVersion: v1 kind: Pod metadata: name: dataset-storage-pod spec: containers: - name: dataset-container image: 'quay.io/prometheus/busybox:latest' command: ["/bin/sh", "-c", "sleep 3600"] volumeMounts: - mountPath: "/data/upload_files" name: dataset-storage volumes: - name: dataset-storage persistentVolumeClaim: claimName: my-pvc EOF -
Copy your locally stored task dataset to the pod to place it within the PVC. In this example, the dataset is named
example-dk-bench-input-bmo.jsonllocally and it is copied to thedataset-storage-podunder the path/data/upload_files/.oc cp example-dk-bench-input-bmo.jsonl dataset-storage-pod:/data/upload_files/example-dk-bench-input-bmo.jsonl -n <MODEL_NAMESPACE> -
Once the custom dataset is uploaded to the PVC, register it as a benchmark for evaluations. At a minimum, provide the following metadata and replace the
DK_BENCH_DATASET_PATHand any other metadata fields to match your specific configuration:-
The TrustyAI LM-Eval Tasks GitHub web address
-
Your branch
-
The commit hash and path of the custom task.
client.benchmarks.register(
    benchmark_id="trustyai_lmeval::dk-bench",
    dataset_id="trustyai_lmeval::dk-bench",
    scoring_functions=["accuracy"],
    provider_benchmark_id="dk-bench",
    provider_id="trustyai_lmeval",
    metadata={
        "custom_task": {
            "git": {
                "url": "https://github.com/trustyai-explainability/lm-eval-tasks.git",
                "branch": "main",
                "commit": "8220e2d73c187471acbe71659c98bccecfe77958",
                "path": "tasks/",
            }
        },
        "env": {
            # Path of the dataset inside the PVC
            "DK_BENCH_DATASET_PATH": "/opt/app-root/src/hf_home/example-dk-bench-input-bmo.jsonl",
            "JUDGE_MODEL_URL": "http://phi-3-predictor:8080/v1/chat/completions",
            # For simplicity, we use the same model as the one being evaluated
            "JUDGE_MODEL_NAME": "phi-3",
            "JUDGE_API_KEY": "",
        },
        "tokenized_requests": False,
        "tokenizer": "google/flan-t5-small",
        "input": {"storage": {"pvc": "my-pvc"}}
    },
)
-
-
Run a benchmark evaluation on your model:
job = client.eval.run_eval( benchmark_id="trustyai_lmeval::dk-bench", benchmark_config={ "eval_candidate": { "type": "model", "model": "phi-3", "provider_id": "trustyai_lmeval", "sampling_params": { "temperature": 0.7, "top_p": 0.9, "max_tokens": 256 }, }, "num_examples": 1000, }, ) print(f"Starting job '{job.job_id}'") -
Monitor the status of the evaluation job. The job runs asynchronously, so you can check its status periodically:
import time
def get_job_status(job_id, benchmark_id):
    return client.eval.jobs.status(job_id=job_id, benchmark_id=benchmark_id)

while True:
    job = get_job_status(job_id=job.job_id, benchmark_id="trustyai_lmeval::dk-bench")
    print(job)

    if job.status in ['failed', 'completed']:
        print(f"Job ended with status: {job.status}")
        break

    time.sleep(20)
Detecting personally identifiable information (PII) by using Guardrails with Llama Stack
The trustyai_fms Orchestrator server is an external provider for Llama Stack that allows you to configure and use the Guardrails Orchestrator and compatible detection models through the Llama Stack API.
This implementation of Llama Stack combines Guardrails Orchestrator with a suite of community-developed detectors to provide robust content filtering and safety monitoring.
This example demonstrates how to use the built-in Guardrails Regex Detector to detect personally identifiable information (PII) with Guardrails Orchestrator as Llama Stack safety guardrails, using the LlamaStack Operator to deploy a distribution in your Open Data Hub namespace.
|
Note
|
Guardrails Orchestrator with Llama Stack is not supported on |
Prerequisites
-
You have cluster administrator privileges for your OpenShift Container Platform cluster.
-
You have installed the OpenShift CLI (
oc) as described in the appropriate documentation for your cluster:-
Installing the OpenShift CLI for OpenShift Container Platform
-
Installing the OpenShift CLI for Red Hat OpenShift Service on AWS
-
-
You have installed Open Data Hub, version 2.29 or later.
-
You have installed Open Data Hub, version 2.20 or later.
-
You have a large language model (LLM) for chat generation or text classification, or both, deployed in your namespace.
-
A cluster administrator has installed the following Operators in OpenShift Container Platform:
-
Red Hat Authorino Operator, version 1.2.1 or later
-
Red Hat OpenShift Service Mesh, version 2.6.7-0 or later
-
Procedure
-
Configure your Open Data Hub environment with the following configurations in the
DataScienceCluster. Note that you must manually update thespec.llamastack.managementStatefield toManaged:spec: trustyai: managementState: Managed llamastack: managementState: Managed kserve: defaultDeploymentMode: RawDeployment managementState: Managed nim: managementState: Managed rawDeploymentServiceConfig: Headless serving: ingressGateway: certificate: type: OpenshiftDefaultIngress managementState: Removed name: knative-serving serviceMesh: managementState: Removed -
Create a project in your Open Data Hub namespace:
PROJECT_NAME="lls-minimal-example" oc new-project $PROJECT_NAME -
Deploy the Guardrails Orchestrator with regex detectors by applying the Orchestrator configuration for regex-based PII detection:
cat <<EOF | oc apply -f - kind: ConfigMap apiVersion: v1 metadata: name: fms-orchestr8-config-nlp data: config.yaml: | detectors: regex: type: text_contents service: hostname: "127.0.0.1" port: 8080 chunker_id: whole_doc_chunker default_threshold: 0.5 --- apiVersion: trustyai.opendatahub.io/v1alpha1 kind: GuardrailsOrchestrator metadata: name: guardrails-orchestrator spec: orchestratorConfig: "fms-orchestr8-config-nlp" enableBuiltInDetectors: true enableGuardrailsGateway: false replicas: 1 EOF -
In the same namespace, create a Llama Stack distribution:
apiVersion: llamastack.io/v1alpha1
kind: LlamaStackDistribution
metadata:
  name: llamastackdistribution-sample
  namespace: <PROJECT_NAMESPACE>
spec:
  replicas: 1
  server:
    containerSpec:
      env:
        - name: VLLM_URL
          value: '${VLLM_URL}'
        - name: INFERENCE_MODEL
          value: '${INFERENCE_MODEL}'
        - name: MILVUS_DB_PATH
          value: '~/.llama/milvus.db'
        - name: VLLM_TLS_VERIFY
          value: 'false'
        - name: FMS_ORCHESTRATOR_URL
          value: '${FMS_ORCHESTRATOR_URL}'
      name: llama-stack
      port: 8321
    distribution:
      name: rh-dev
    storage:
      size: 20Gi
|
Note
|
— After deploying the LlamaStackDistribution CR, a new pod is created in the same namespace. This pod runs the LlamaStack server for your distribution.
—
|
-
Once the Llama Stack server is running, use the
/v1/shieldsendpoint to dynamically register a shield. For example, register a shield that uses regex patterns to detect personally identifiable information (PII). -
Open a port-forward to access it locally:
oc -n $PROJECT_NAME port-forward svc/llama-stack 8321:8321 -
Use the
/v1/shieldsendpoint to dynamically register a shield. For example, register a shield that uses regex patterns to detect personally identifiable information (PII):curl -X POST http://localhost:8321/v1/shields \ -H 'Content-Type: application/json' \ -d '{ "shield_id": "regex_detector", "provider_shield_id": "regex_detector", "provider_id": "trustyai_fms", "params": { "type": "content", "confidence_threshold": 0.5, "message_types": ["system", "user"], "detectors": { "regex": { "detector_params": { "regex": ["email", "us-social-security-number", "credit-card"] } } } } }' -
Verify that the shield was registered:
curl -s http://localhost:8321/v1/shields | jq '.' -
The following output indicates that the shield has been registered successfully:
{ "data": [ { "identifier": "regex_detector", "provider_resource_id": "regex_detector", "provider_id": "trustyai_fms", "type": "shield", "params": { "type": "content", "confidence_threshold": 0.5, "message_types": [ "system", "user" ], "detectors": { "regex": { "detector_params": { "regex": [ "email", "us-social-security-number", "credit-card" ] } } } } } ] } -
Once the shield has been registered, verify that it is working by sending a message containing PII to the
/v1/safety/run-shieldendpoint:-
Email detection example:
curl -X POST http://localhost:8321/v1/safety/run-shield \
-H "Content-Type: application/json" \
-d '{
  "shield_id": "regex_detector",
  "messages": [
    {
      "content": "My email is test@example.com",
      "role": "user"
    }
  ]
}' | jq '.'
This should return a response indicating that the email was detected:
{ "violation": { "violation_level": "error", "user_message": "Content violation detected by shield regex_detector (confidence: 1.00, 1/1 processed messages violated)", "metadata": { "status": "violation", "shield_id": "regex_detector", "confidence_threshold": 0.5, "summary": { "total_messages": 1, "processed_messages": 1, "skipped_messages": 0, "messages_with_violations": 1, "messages_passed": 0, "message_fail_rate": 1.0, "message_pass_rate": 0.0, "total_detections": 1, "detector_breakdown": { "active_detectors": 1, "total_checks_performed": 1, "total_violations_found": 1, "violations_per_message": 1.0 } }, "results": [ { "message_index": 0, "text": "My email is test@example.com", "status": "violation", "score": 1.0, "detection_type": "pii", "individual_detector_results": [ { "detector_id": "regex", "status": "violation", "score": 1.0, "detection_type": "pii" } ] } ] } } } -
Social security number (SSN) detection example:
curl -X POST http://localhost:8321/v1/safety/run-shield \
-H "Content-Type: application/json" \
-d '{
    "shield_id": "regex_detector",
    "messages": [
      {
        "content": "My SSN is 123-45-6789",
        "role": "user"
      }
    ]
}' | jq '.'
This should return a response indicating that the SSN was detected:
{ "violation": { "violation_level": "error", "user_message": "Content violation detected by shield regex_detector (confidence: 1.00, 1/1 processed messages violated)", "metadata": { "status": "violation", "shield_id": "regex_detector", "confidence_threshold": 0.5, "summary": { "total_messages": 1, "processed_messages": 1, "skipped_messages": 0, "messages_with_violations": 1, "messages_passed": 0, "message_fail_rate": 1.0, "message_pass_rate": 0.0, "total_detections": 1, "detector_breakdown": { "active_detectors": 1, "total_checks_performed": 1, "total_violations_found": 1, "violations_per_message": 1.0 } }, "results": [ { "message_index": 0, "text": "My SSN is 123-45-6789", "status": "violation", "score": 1.0, "detection_type": "pii", "individual_detector_results": [ { "detector_id": "regex", "status": "violation", "score": 1.0, "detection_type": "pii" } ] } ] } } } -
Credit card detection example:
curl -X POST http://localhost:8321/v1/safety/run-shield \
-H "Content-Type: application/json" \
-d '{
    "shield_id": "regex_detector",
    "messages": [
      {
        "content": "My credit card number is 4111-1111-1111-1111",
        "role": "user"
      }
    ]
}' | jq '.'
This should return a response indicating that the credit card number was detected:
{
  "violation": {
    "violation_level": "error",
    "user_message": "Content violation detected by shield regex_detector (confidence: 1.00, 1/1 processed messages violated)",
    "metadata": {
      "status": "violation",
      "shield_id": "regex_detector",
      "confidence_threshold": 0.5,
      "summary": {
        "total_messages": 1,
        "processed_messages": 1,
        "skipped_messages": 0,
        "messages_with_violations": 1,
        "messages_passed": 0,
        "message_fail_rate": 1.0,
        "message_pass_rate": 0.0,
        "total_detections": 1,
        "detector_breakdown": {
          "active_detectors": 1,
          "total_checks_performed": 1,
          "total_violations_found": 1,
          "violations_per_message": 1.0
        }
      },
      "results": [
        {
          "message_index": 0,
          "text": "My credit card number is 4111-1111-1111-1111",
          "status": "violation",
          "score": 1.0,
          "detection_type": "pii",
          "individual_detector_results": [
            {
              "detector_id": "regex",
              "status": "violation",
              "score": 1.0,
              "detection_type": "pii"
            }
          ]
        }
      ]
    }
  }
}
-
Bias monitoring tutorial - Gender bias example
Step-by-step guidance for using TrustyAI in Open Data Hub to monitor machine learning models for bias.
Introduction
Ensuring that your machine learning models are fair and unbiased is essential for building trust with your users. Although you can assess fairness during model training, it is only in deployment that your models use real-world data. Even if your models are unbiased on training data, they can exhibit serious biases in real-world scenarios. Therefore, it is crucial to monitor your models for fairness during their real-world deployment.
In this tutorial, you learn how to monitor models for bias. You will use two example models to complete the following tasks:
-
Deploy the models by using multi-model serving.
-
Send training data to the models.
-
Examine the metadata for the models.
-
Check model fairness.
-
Schedule and check fairness and identity metric requests.
-
Simulate real-world data.
About the example models
For this tutorial, your role is a DevOps engineer for a credit lending company. The company’s data scientists have created two candidate neural network models to predict whether a borrower will default on a loan. Both models make predictions based on the following information from the borrower’s application:
-
Number of Children
-
Total Income
-
Number of Total Family Members
-
Is Male-Identifying?
-
Owns Car?
-
Owns Realty?
-
Is Partnered?
-
Is Employed?
-
Lives with Parents?
-
Age (in days)
-
Length of Employment (in days)
As the DevOps engineer, your task is to verify that the models are not biased against the Is Male-Identifying? gender field. To complete this task, you can monitor the models by using the Statistical Parity Difference (SPD) metric, which reports whether there is a difference between how often male-identifying and non-male-identifying applicants are given favorable predictions (that is, they are predicted to pay off their loans). An ideal SPD metric is 0, meaning both groups are equally likely to receive a positive outcome. An SPD between -0.1 and 0.1 also indicates fairness, as it reflects only a +/-10% variation between the groups.
Setting up your environment
To set up your environment for this tutorial, complete the following tasks:
-
Download tutorial files from the trustyai-explainability repository.
-
Log in to the OpenShift cluster from the command line.
-
Configure monitoring for the model serving platform.
-
Enable the TrustyAI component in the Open Data Hub Operator.
-
Set up a project.
-
Authenticate the TrustyAI service.
Prerequisites
-
The Open Data Hub Operator is installed on your OpenShift Container Platform cluster.
-
You have cluster administrator privileges for your OpenShift Container Platform cluster.
-
You have installed the OpenShift CLI (
oc) as described in the appropriate documentation for your cluster:-
Installing the OpenShift CLI for OpenShift Container Platform
-
Installing the OpenShift CLI for Red Hat OpenShift Service on AWS
-
Downloading the tutorial files
-
Go to https://github.com/trustyai-explainability/odh-trustyai-demos/tree/main.
-
Click the Code button and then click Download ZIP to download the repository.
-
Extract the downloaded repository files.
Logging in to the OpenShift cluster from the command line
-
Obtain the command for logging in to the OpenShift cluster from the command line:
-
In the upper-right corner of the OpenShift Container Platform web console, click your user name and select Copy login command.
-
Log in with your credentials and then click Display token.
-
Copy the Log in with this token command, which has the following syntax:
$ oc login --token=<token> --server=<openshift_cluster_url>
-
-
In a terminal window, paste and run the login command.
Configuring monitoring for the model serving platform
To enable monitoring on user-defined projects, you must configure monitoring for the model serving platform.
-
Run the following command from the directory containing the downloaded tutorial files (
odh-trustyai-demos-main):oc apply -f 1-Installation/resources/enable_uwm.yaml -
To configure monitoring to store metric data for 15 days, run the following command from the directory containing the downloaded tutorial files (
odh-trustyai-demos-main):oc apply -f 1-Installation/resources/uwm_configmap.yaml
For more information, see Configuring monitoring for the multi-model serving platform.
Enabling the TrustyAI component
To allow your data scientists to use model monitoring with TrustyAI, you must enable the TrustyAI component in Open Data Hub.
Prerequisites
-
You have cluster administrator privileges for your OpenShift Container Platform cluster.
-
You have access to the data science cluster.
-
You have installed Open Data Hub.
Procedure
-
In the OpenShift Container Platform console, click Operators → Installed Operators.
-
Search for the Open Data Hub Operator, and then click the Operator name to open the Operator details page.
-
Click the Data Science Cluster tab.
-
Click the default instance name (for example, default-dsc) to open the instance details page.
-
Click the YAML tab to show the instance specifications.
-
In the
spec:componentssection, set themanagementStatefield for thetrustyaicomponent toManaged:trustyai: managementState: Managed -
Click Save.
Verification
Check the status of the trustyai-service-operator pod:
-
In the OpenShift Container Platform console, from the Project list, select opendatahub.
-
Click Workloads → Deployments.
-
Search for the trustyai-service-operator-controller-manager deployment. Check the status:
-
Click the deployment name to open the deployment details page.
-
Click the Pods tab.
-
View the pod status.
When the status of the trustyai-service-operator-controller-manager-<pod-id> pod is Running, the pod is ready to use.
-
Setting up a project
For this tutorial, you must create a project named model-namespace.
-
To create a new project named
model-namespace, run the following command from the directory containing the downloaded tutorial files (odh-trustyai-demos-main):oc new-project model-namespace -
Prepare the
model-namespaceproject for multi-model serving:oc label namespace model-namespace "modelmesh-enabled=true" --overwrite=true
Authenticating the TrustyAI service
TrustyAI endpoints are authenticated with a Bearer token. To obtain this token and set a variable (TOKEN) to use later, run the following command:
export TOKEN=$(oc whoami -t)Deploying models
Procedure
To deploy the models for this tutorial, run the following commands from the directory containing the downloaded tutorial files (odh-trustyai-demos-main).
-
Navigate to the
model-namespaceproject you created:oc project model-namespace -
Deploy the model’s storage container:
oc apply -f 2-BiasMonitoring/resources/model_storage_container.yaml -
Deploy the OVMS 1.x serving runtime:
oc apply -f 2-BiasMonitoring/resources/ovms-1.x.yaml -
Deploy the first model:
oc apply -f 2-BiasMonitoring/resources/model_alpha.yaml -
Deploy the second model:
oc apply -f 2-BiasMonitoring/resources/model_beta.yaml
Verification
-
In the OpenShift Container Platform console, click Workloads → Pods.
-
Confirm that there are four pods:
-
minio -
modelmesh-serving-ovms-1.x-xxxxxxxxxx-xxxxx -
modelmesh-serving-ovms-1.x-xxxxxxxxxx-xxxxx -
trustyai-service-xxxxxxxxxx-xxxxxWhen the TrustyAI service has registered the deployed models, the
modelmesh-serving-ovms-1.x-xxxxxpods are redeployed.
-
-
To verify that TrustyAI has registered the models:
-
Select one of the
modelmesh-serving-ovms-1.x-xxxxxpods. -
Click the Environment tab and confirm that the
MM_PAYLOAD_PROCESSORSfield is set.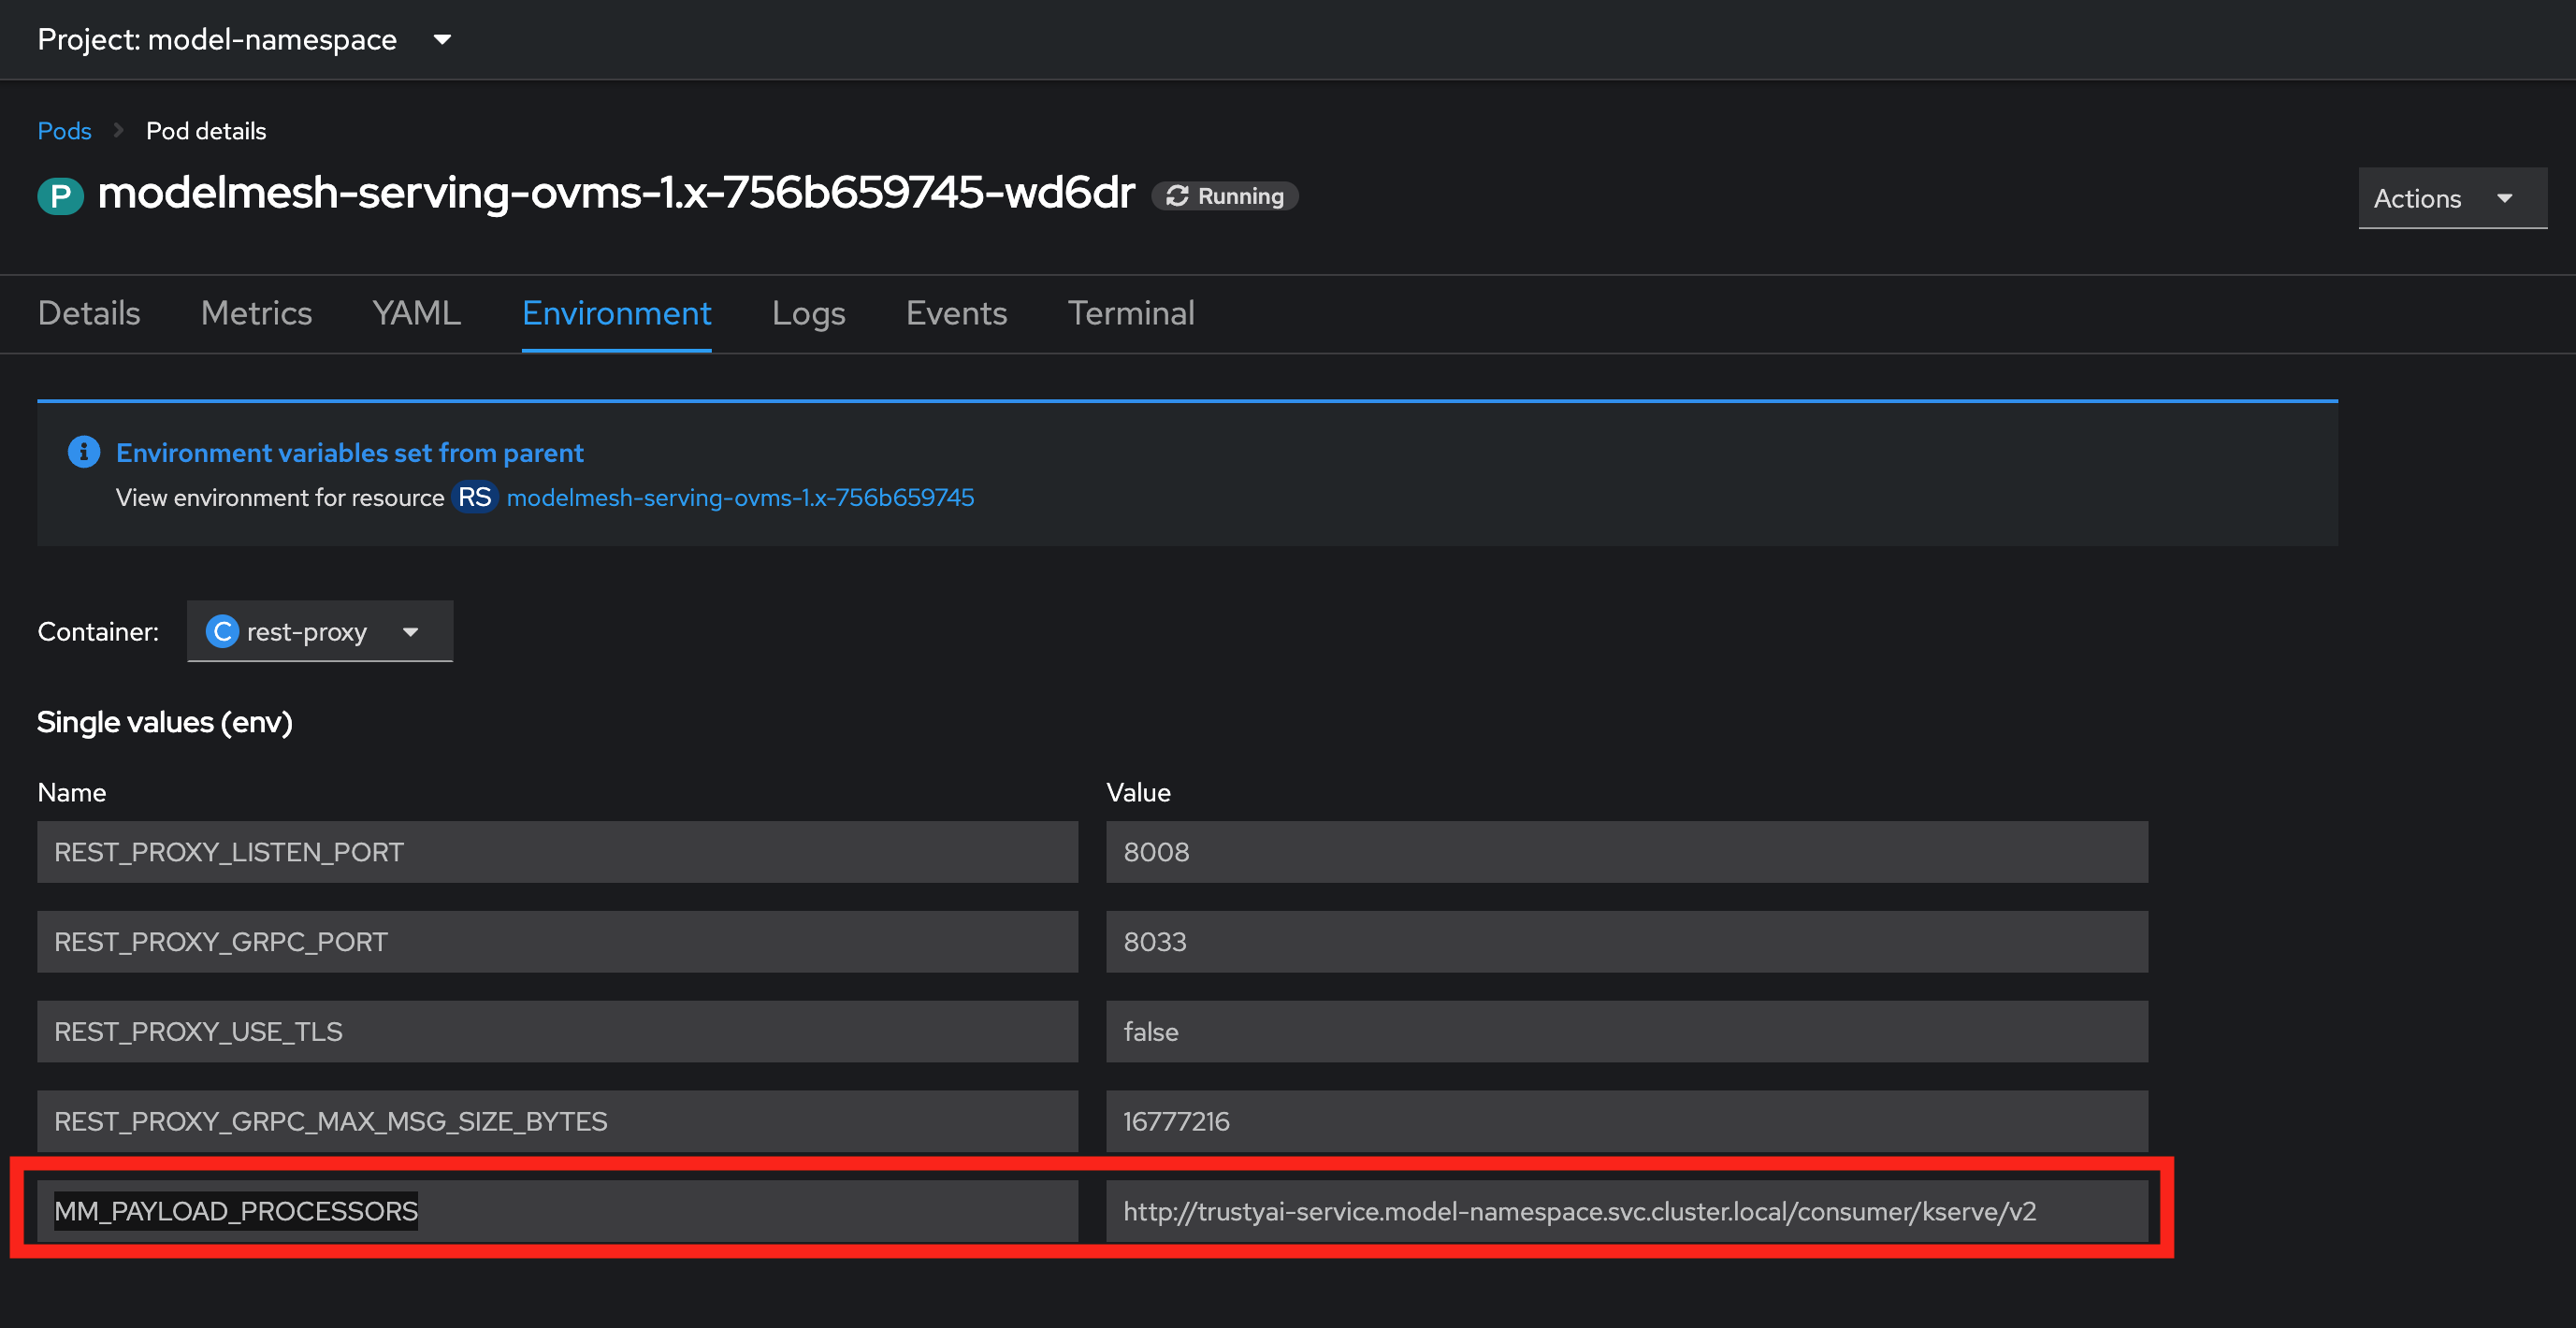
-
Sending training data to the models
Pass the training data through the models.
Procedure
-
In a terminal window, run the following command from the directory that contains the downloaded tutorial files (
odh-trustyai-demos-main):for batch in 0 250 500 750 1000 1250 1500 1750 2000 2250; do 2-BiasMonitoring/scripts/send_data_batch 2-BiasMonitoring/data/training/$batch.json doneThis process can take several minutes.
Verification
-
View the script verification messages that indicate whether TrustyAI is receiving the data.
-
Verify that the process is running by viewing the cluster metrics:
-
In the OpenShift Container Platform web console, click Observe → Metrics.
-
In the Expression field, enter
trustyai_model_observations_totaland click Run Queries. -
Confirm that both models are listed with around 2250 inferences each, which indicates that TrustyAI has cataloged enough inputs and outputs to begin analysis.
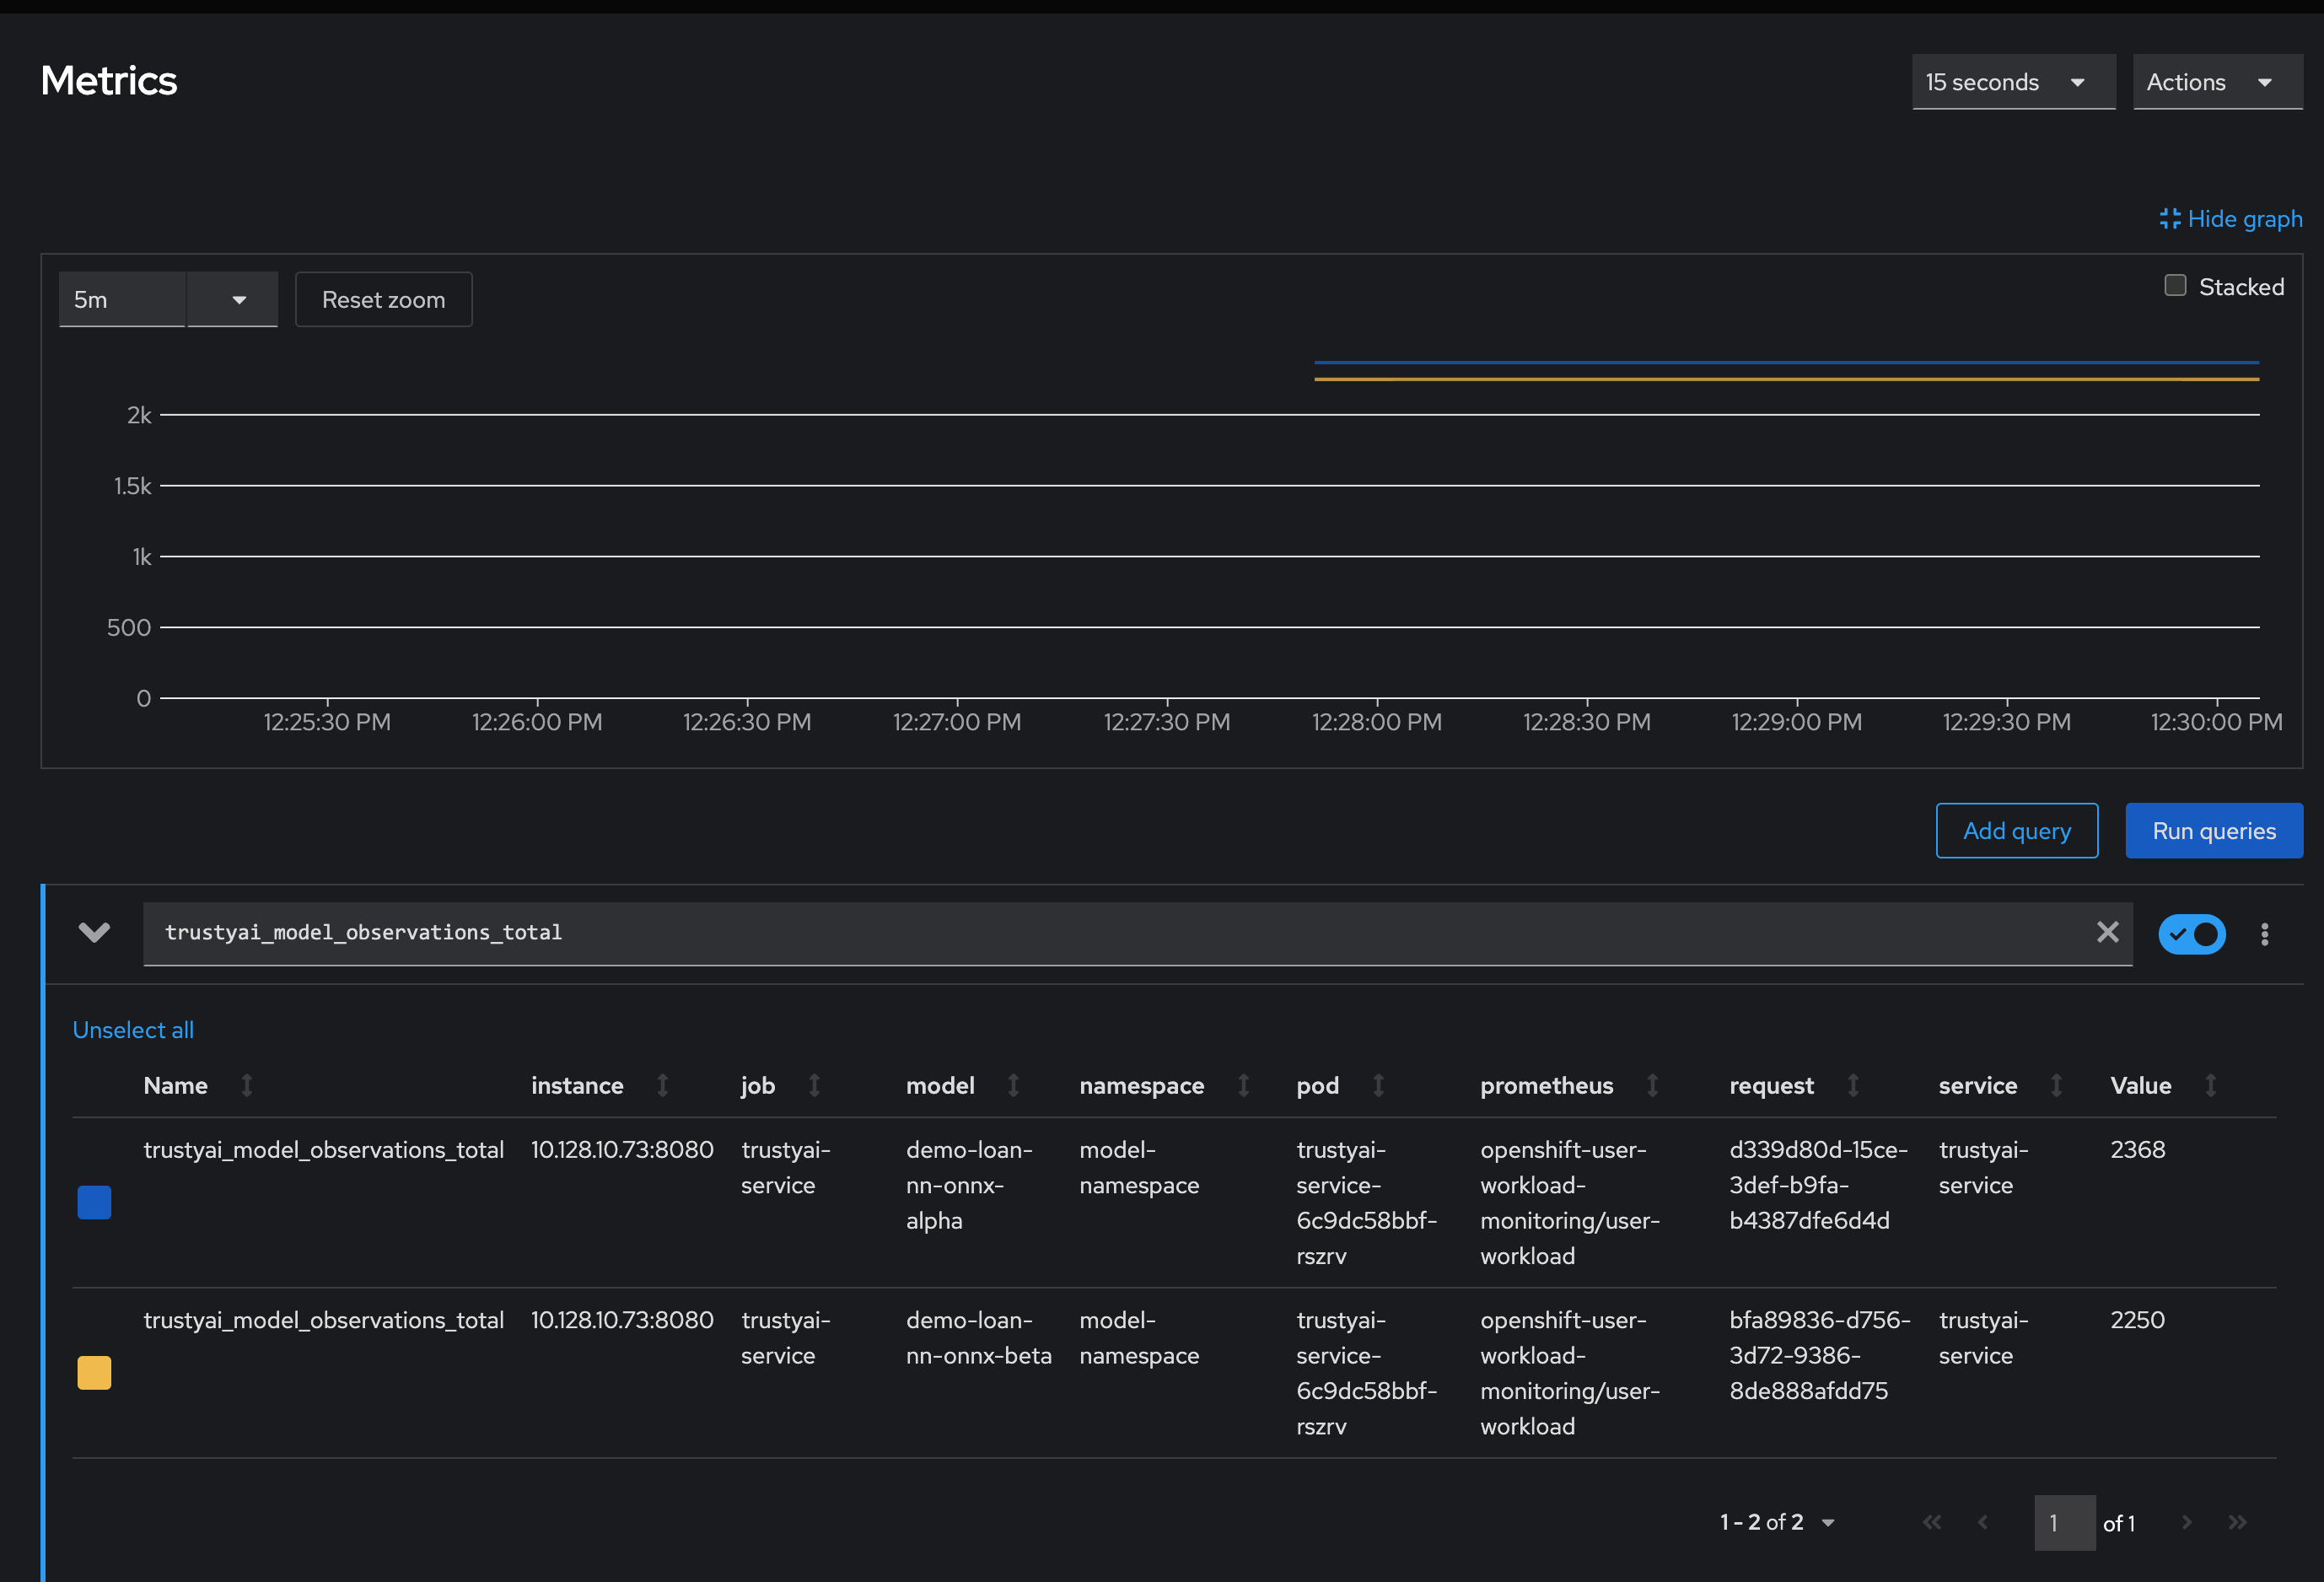
-
Optional: You can select a time range and refresh interval:
-
From the Time range list, select 5 minutes.
-
From the Refresh interval list, select 15 seconds.
-
-
-
Verify that TrustyAI can access the models by examining the model metadata:
-
Find the route to the TrustyAI service:
TRUSTY_ROUTE=https://$(oc get route/trustyai-service --template={{.spec.host}}); echo $TRUSTY_ROUTE -
Query the
/infoendpoint:curl -H "Authorization: Bearer ${TOKEN}" $TRUSTY_ROUTE/info | jqA JSON file is generated with the following information for each model:
-
The names, data types, and positions of fields in the input and output.
-
The observed values that these fields take.
-
The total number of input-output pairs observed.
-
For an example output file, see the
odh-trustyai-demos-main/2-BiasMonitoring/scripts/info_response.jsonfile in your downloaded tutorial files. -
Labeling data fields
You can apply name mappings to your inputs and outputs for more meaningful field names by sending a POST request to the /info/names endpoint.
For this tutorial, run the following command from the directory containing the downloaded tutorial files (odh-trustyai-demos-main):
2-BiasMonitoring/scripts/apply_name_mapping.shFor general steps, see Labeling data fields.
To understand the payload structure, see the odh-trustyai-demos-main/2-BiasMonitoring/scripts/apply_name_mapping.sh file in your downloaded tutorial files.
Checking model fairness
Compute the model’s cumulative fairness up to this point.
Procedure
-
In a terminal window, run the following script from the directory containing the downloaded tutorial files (
odh-trustyai-demos-main) to check the/metrics/group/fairness/spdendpoint:echo -e "=== MODEL ALPHA ===" curl -sk -H "Authorization: Bearer ${TOKEN}" -X POST --location $TRUSTY_ROUTE/metrics/group/fairness/spd/ \ --header 'Content-Type: application/json' \ --data "{ \"modelId\": \"demo-loan-nn-onnx-alpha\", \"protectedAttribute\": \"Is Male-Identifying?\", \"privilegedAttribute\": 1.0, \"unprivilegedAttribute\": 0.0, \"outcomeName\": \"Will Default?\", \"favorableOutcome\": 0, \"batchSize\": 5000 }" | jq echo -e "\n\n=== MODEL BETA ===" curl -sk -H "Authorization: Bearer ${TOKEN}" -X POST --location $TRUSTY_ROUTE/metrics/group/fairness/spd \ --header 'Content-Type: application/json' \ --data "{ \"modelId\": \"demo-loan-nn-onnx-beta\", \"protectedAttribute\": \"Is Male-Identifying?\", \"privilegedAttribute\": 1.0, \"unprivilegedAttribute\": 0.0, \"outcomeName\": \"Will Default?\", \"favorableOutcome\": 0, \"batchSize\": 5000 }" | jq echo
The payload structure is as follows:
-
modelId: The name of the model to query. -
protectedAttribute: The name of the feature that distinguishes the groups that you are checking for fairness over. -
privilegedAttribute: The value of theprotectedAttributethat describes the suspected favored (positively biased) class. -
unprivilegedAttribute: The value of theprotectedAttributethat describes the suspected unfavored (negatively biased) class. -
outcomeName: The name of the output that provides the output you are examining for fairness. -
favorableOutcome: The value of theoutcomeNameoutput that describes the favorable model prediction. -
batchSize: The number of previous inferences to include in the calculation.
Verification
Confirm that you see outputs similar to the following examples:
- Model Alpha
=== MODEL ALPHA ===
{
  "timestamp": "2024-07-25T16:26:50.412+00:00",
  "type": "metric",
  "value": 0.003056835834369387,
  "namedValues": null,
  "specificDefinition": "The SPD of 0.003057 indicates that the likelihood of Group:Is Male-Identifying?=[1.0] receiving Outcome:Will Default?=[0] was 0.305684 percentage points higher than that of Group:Is Male-Identifying?=[0.0].",
  "name": "SPD",
  "id": "542bd51e-dd2f-40f6-947f-c1c22bd71765",
  "thresholds": {
    "lowerBound": -0.1,
    "upperBound": 0.1,
    "outsideBounds": false
  }
}- Model Beta
=== MODEL BETA ===
{
  "timestamp": "2024-07-25T16:26:50.648+00:00",
  "type": "metric",
  "value": 0.029078518433627354,
  "namedValues": null,
  "specificDefinition": "The SPD of 0.029079 indicates that the likelihood of Group:Is Male-Identifying?=[1.0] receiving Outcome:Will Default?=[0] was 2.907852 percentage points higher than that of Group:Is Male-Identifying?=[0.0].",
  "name": "SPD",
  "id": "df292f06-9255-4158-8b02-4813a8777b7b",
  "thresholds": {
    "lowerBound": -0.1,
    "upperBound": 0.1,
    "outsideBounds": false
  }
}
The specificDefinition field is important in understanding the real-world interpretation of these metric values; you can see that both model Alpha and Beta are fair over the Is Male-Identifying field, with the two groups' rates of positive outcomes only differing by -0.3% for model Alpha and 2.8% for model Beta.
Scheduling a fairness metric request
After you confirm that the models are fair over the training data, you want to ensure that they remain fair over real-world inference data. To monitor their fairness, you can schedule a metric request to compute at recurring intervals throughout deployment by passing the same payloads to the /metrics/group/fairness/spd/request endpoint.
Procedure
-
In a terminal window, run the following script from the directory containing the downloaded tutorial files (
odh-trustyai-demos-main):echo -e "\n\n=== MODEL ALPHA ===\n" curl -sk -H "Authorization: Bearer ${TOKEN}" -X POST --location $TRUSTY_ROUTE/metrics/group/fairness/spd/request \ --header 'Content-Type: application/json' \ --data "{ \"modelId\": \"demo-loan-nn-onnx-alpha\", \"protectedAttribute\": \"Is Male-Identifying?\", \"privilegedAttribute\": 1.0, \"unprivilegedAttribute\": 0.0, \"outcomeName\": \"Will Default?\", \"favorableOutcome\": 0, \"batchSize\": 5000 }" echo -e "\n\n=== MODEL BETA ===\n" curl -sk -H "Authorization: Bearer ${TOKEN}" -X POST --location $TRUSTY_ROUTE/metrics/group/fairness/spd/request \ --header 'Content-Type: application/json' \ --data "{ \"modelId\": \"demo-loan-nn-onnx-beta\", \"protectedAttribute\": \"Is Male-Identifying?\", \"privilegedAttribute\": 1.0, \"unprivilegedAttribute\": 0.0, \"outcomeName\": \"Will Default?\", \"favorableOutcome\": 0, \"batchSize\": 5000 }" echo
These commands return the IDs of the created requests. Later, you can use these IDs to delete the scheduled requests.
Verification
-
In the OpenShift Container Platform web console, click Observe → Metrics.
-
In the Expression field, enter
trustyai_spdand click Run Queries. -
Optional: After running a query, you can select a time range and refresh interval:
-
From the Time range list, select 5 minutes.
-
From the Refresh interval list, select 15 seconds.
-
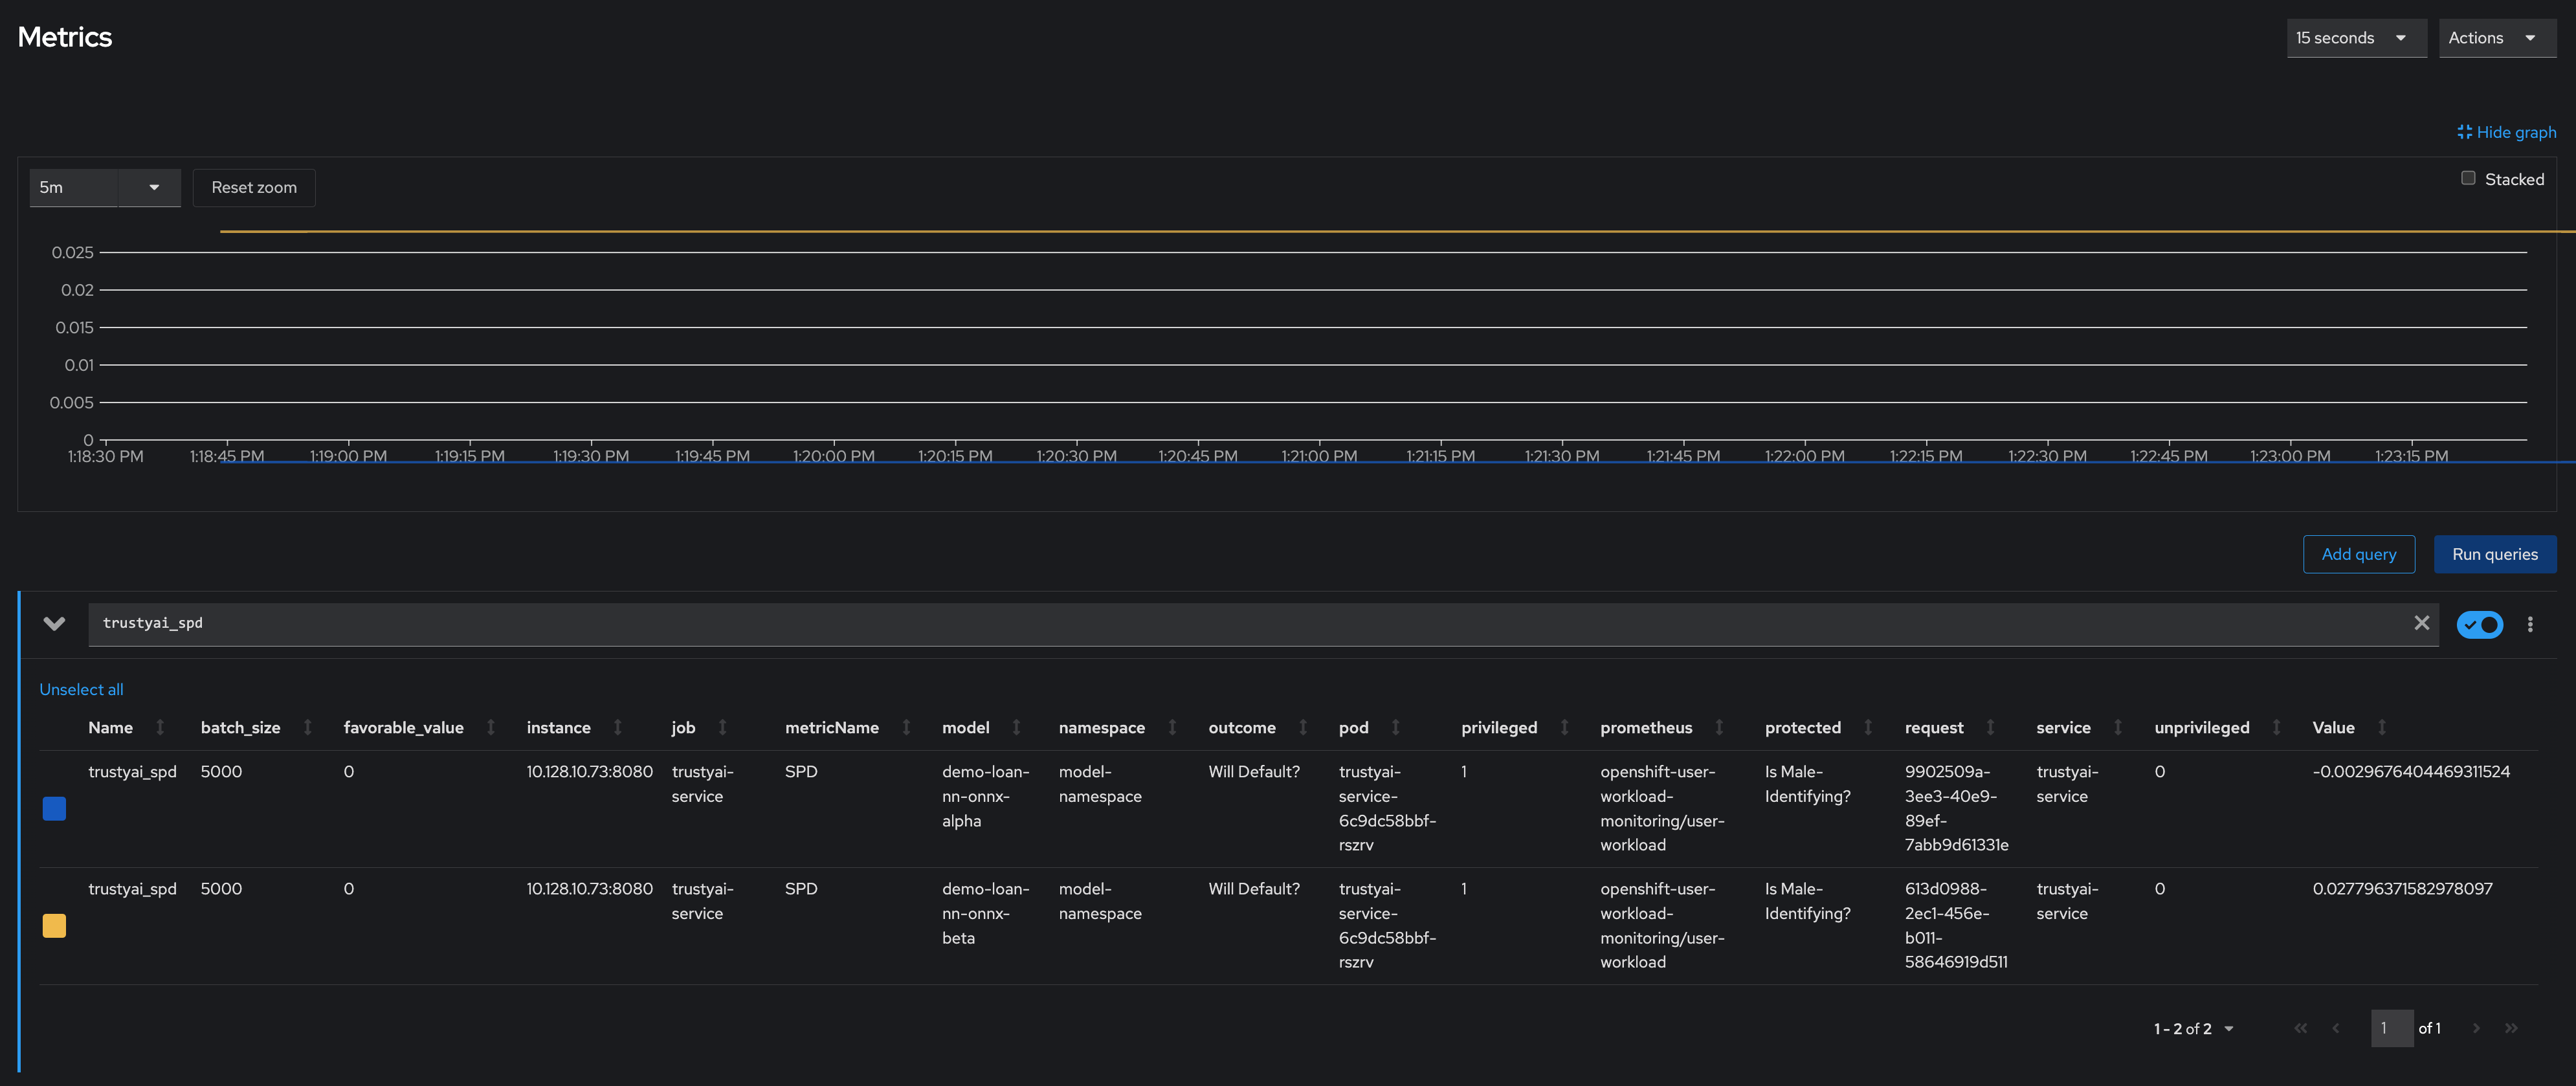
Scheduling an identity metric request
You can monitor the average values of various data fields over time to see the average ratio of loan-payback to loan-default predictions and the average ratio of male-identifying to non-male-identifying applicants. To monitor the average values, you create an identity metric request by sending a POST request to the /metrics/identity/request endpoint.
Procedure
-
In a terminal window, run the following command from the directory containing the downloaded tutorial files (
odh-trustyai-demos-main):for model in "demo-loan-nn-onnx-alpha" "demo-loan-nn-onnx-beta"; do for field in "Is Male-Identifying?" "Will Default?"; do curl -sk -H "Authorization: Bearer ${TOKEN}" -X POST --location $TRUSTY_ROUTE/metrics/identity/request \ --header 'Content-Type: application/json' \ --data "{ \"columnName\": \"$field\", \"batchSize\": 250, \"modelId\": \"$model\" }" echo -e done done
The payload structure is as follows:
-
columnName: The name of the field to compute the averaging over. -
batchSize: The number of previous inferences to include in the average-value calculation. -
modelId: The name of the model to query.
Verification
-
In the OpenShift Container Platform web console, click Observe → Metrics.
-
In the Expression field, enter
trustyai_identityand click Run Queries. -
Optional: After running a query, you can select a time range and refresh interval:
-
From the Time range list, select 5 minutes.
-
From the Refresh interval list, select 15 seconds.
-
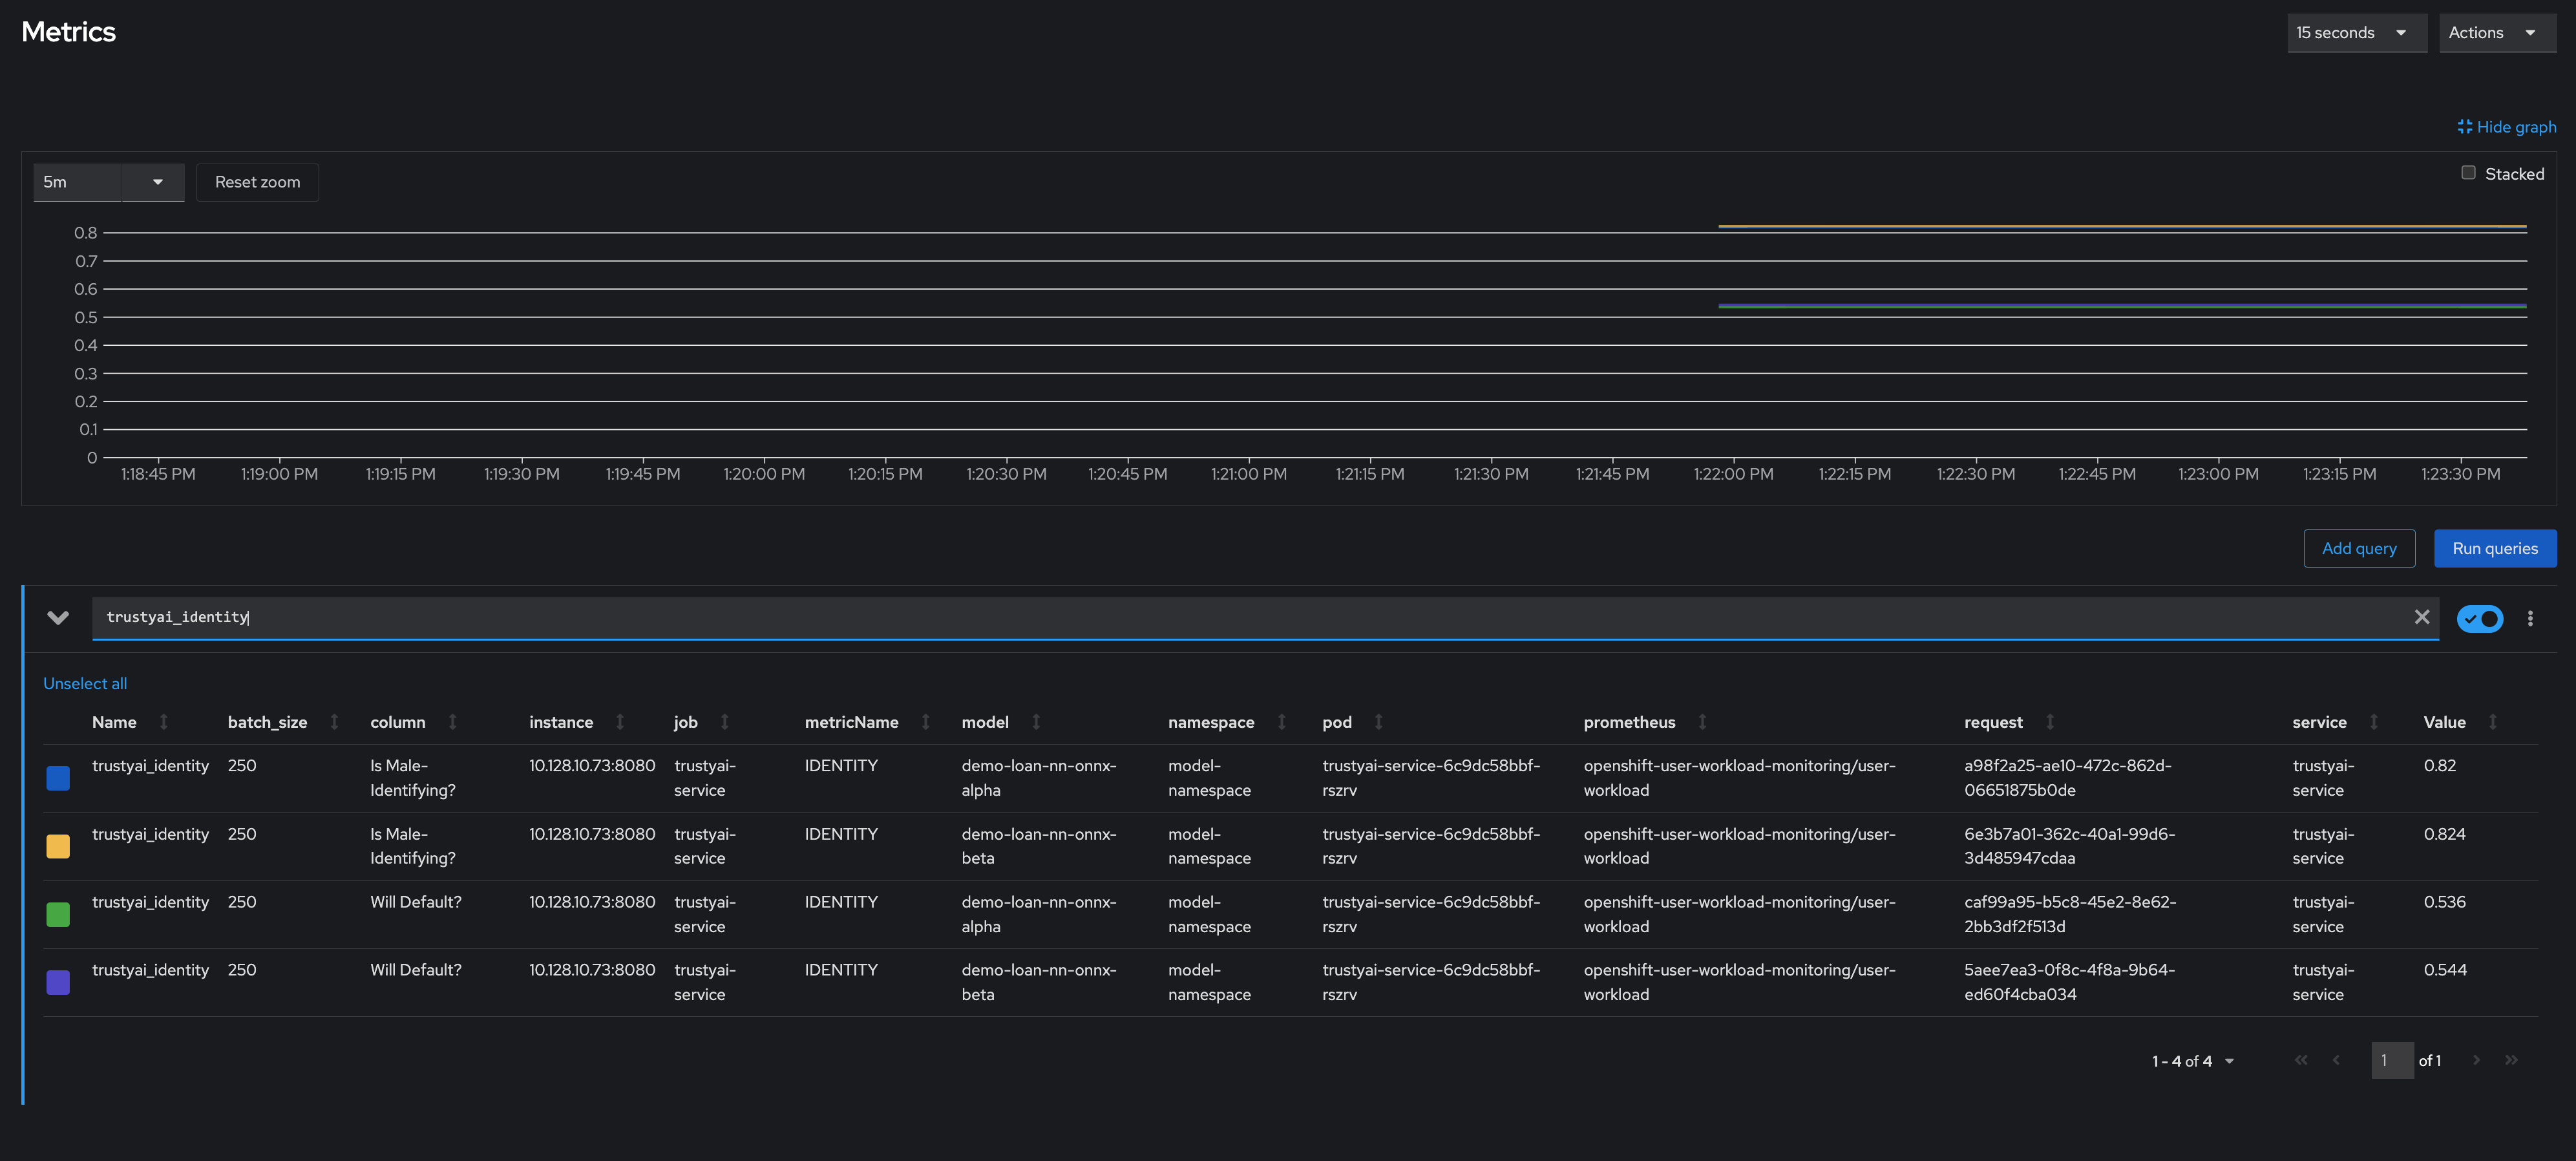
Simulating real world data
Now that you have scheduled your fairness and identify metric requests, you can simulate sending some "real world" data through your models to see if they remain fair.
Procedure
-
In a terminal window, run the following command from the directory containing the downloaded tutorial files (
odh-trustyai-demos-main):for batch in "01" "02" "03" "04" "05" "06" "07" "08"; do ./2-BiasMonitoring/scripts/send_data_batch 2-BiasMonitoring/data/batch_$batch.json sleep 5 done
Verification
-
In the OpenShift Container Platform web console, click Observe → Metrics and watch the SPD and identity metric request values change.
Reviewing the results
Are the models biased?
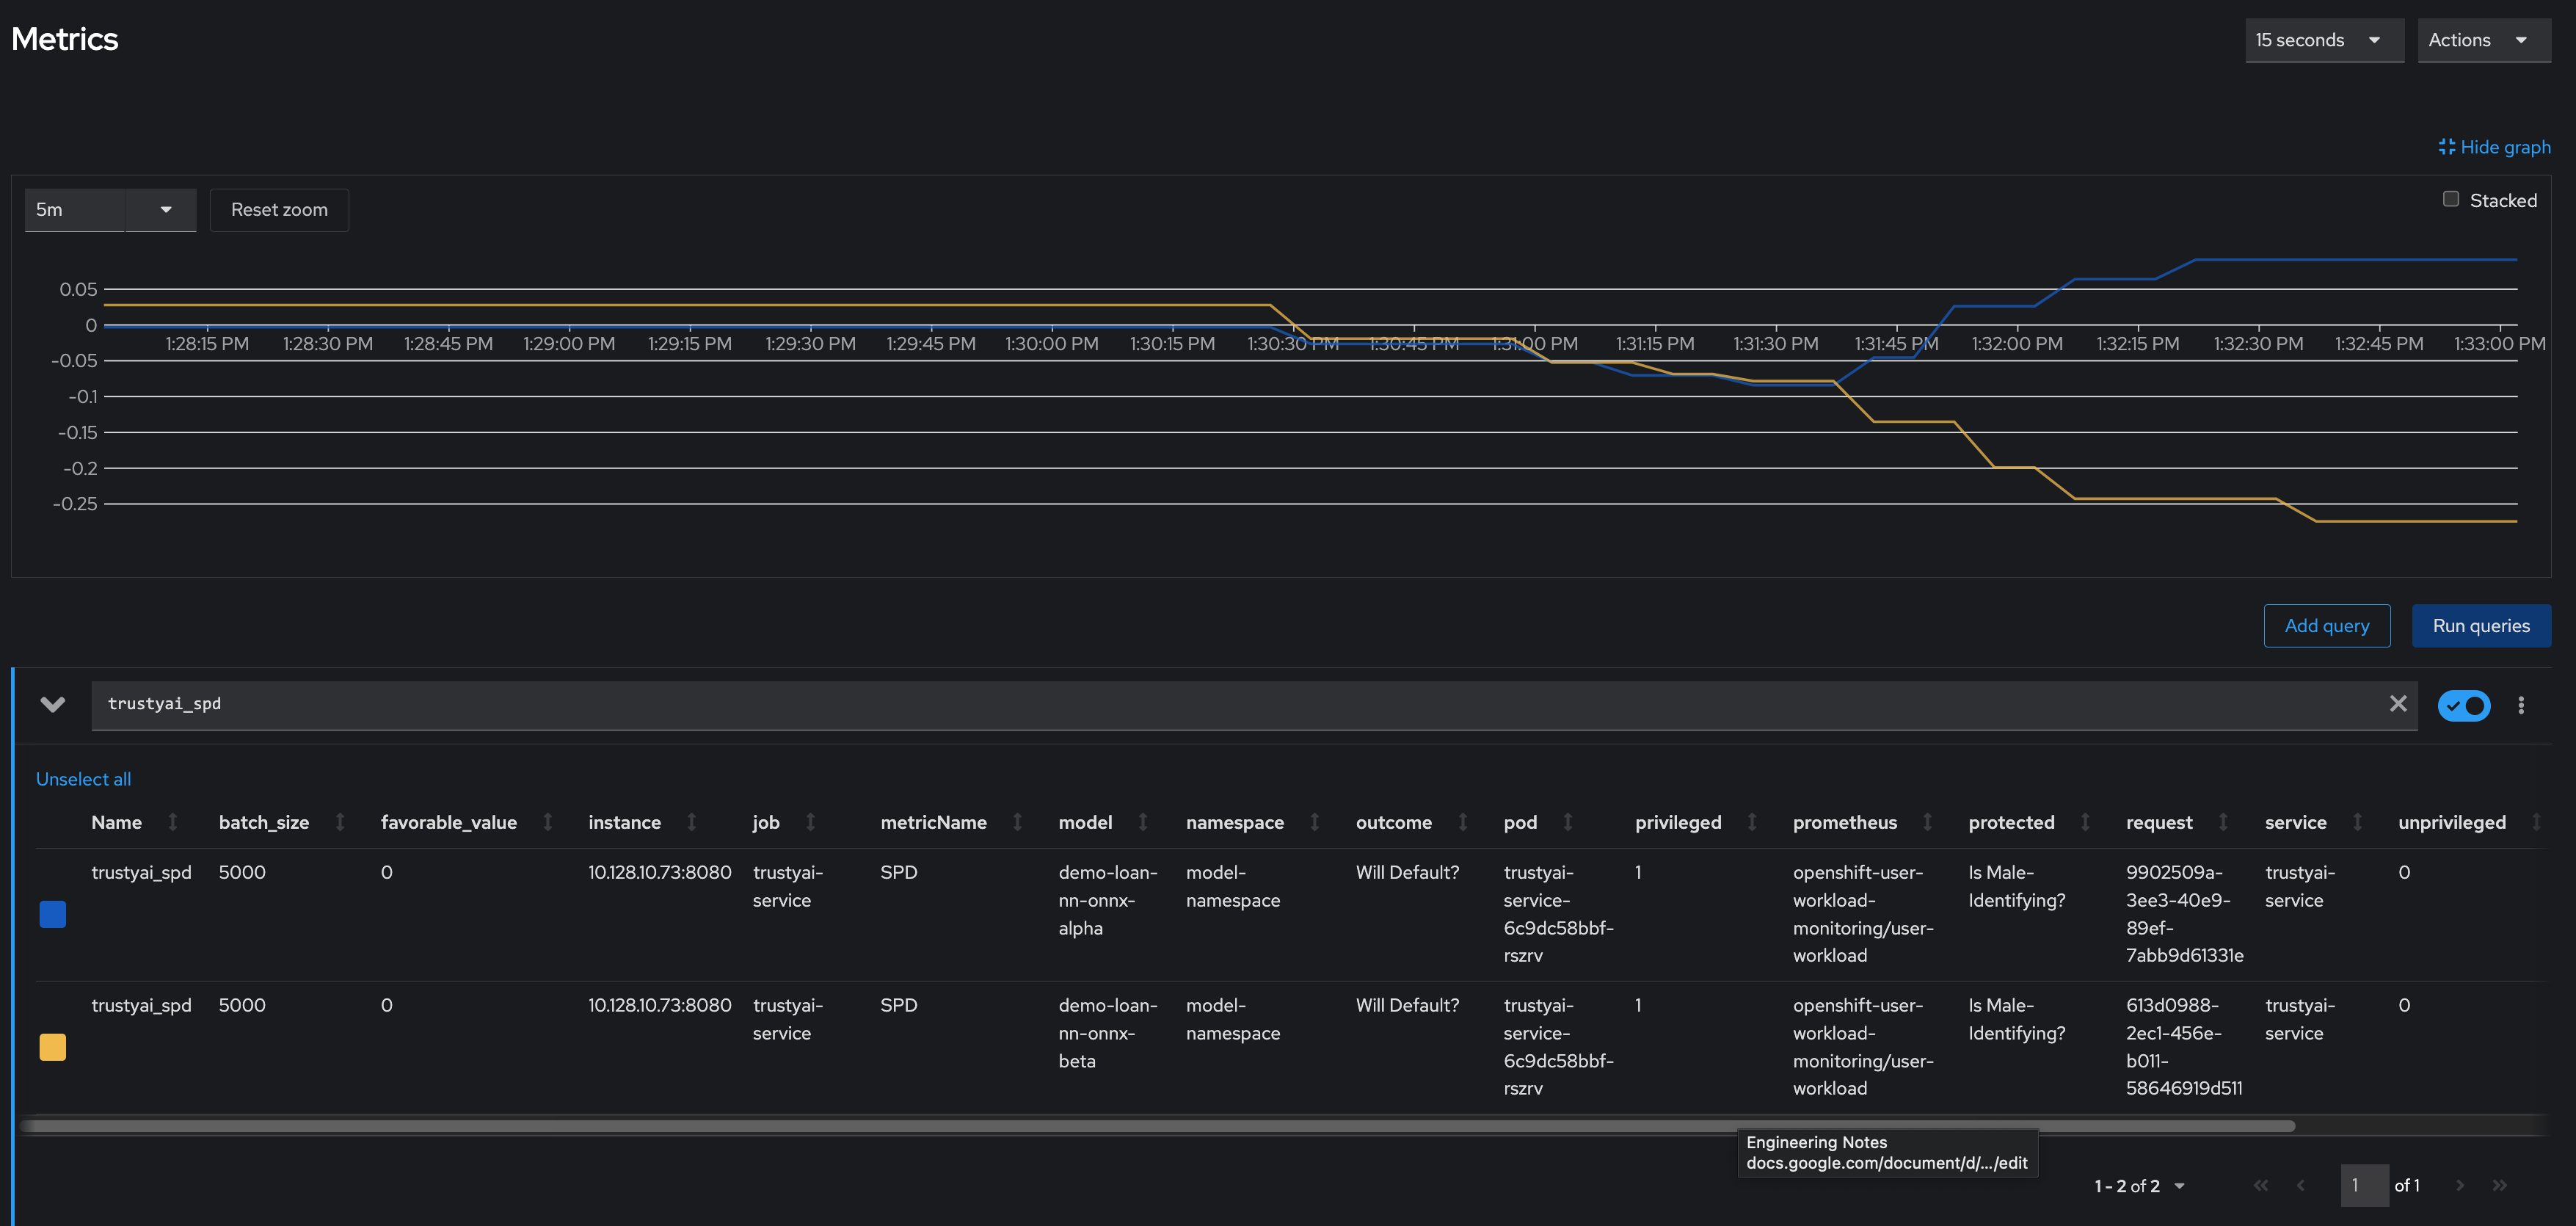
The two models have drastically different fairness levels when applied to the simulated real-world data. Model Alpha (blue) stayed within the "acceptably fair" range between -0.1 and 0.1, ending around 0.09. However, Model Beta (yellow) plummeted out of the fair range, ending at -0.274. This indicates that non-male-identifying applicants were 27% less likely to receive a favorable outcome from Model Beta compared to male-identifying applicants.
To explore this further, you can analyze your identity metrics, starting by looking at the inbound ratio of male-identifying to non-male-identifying applicants:
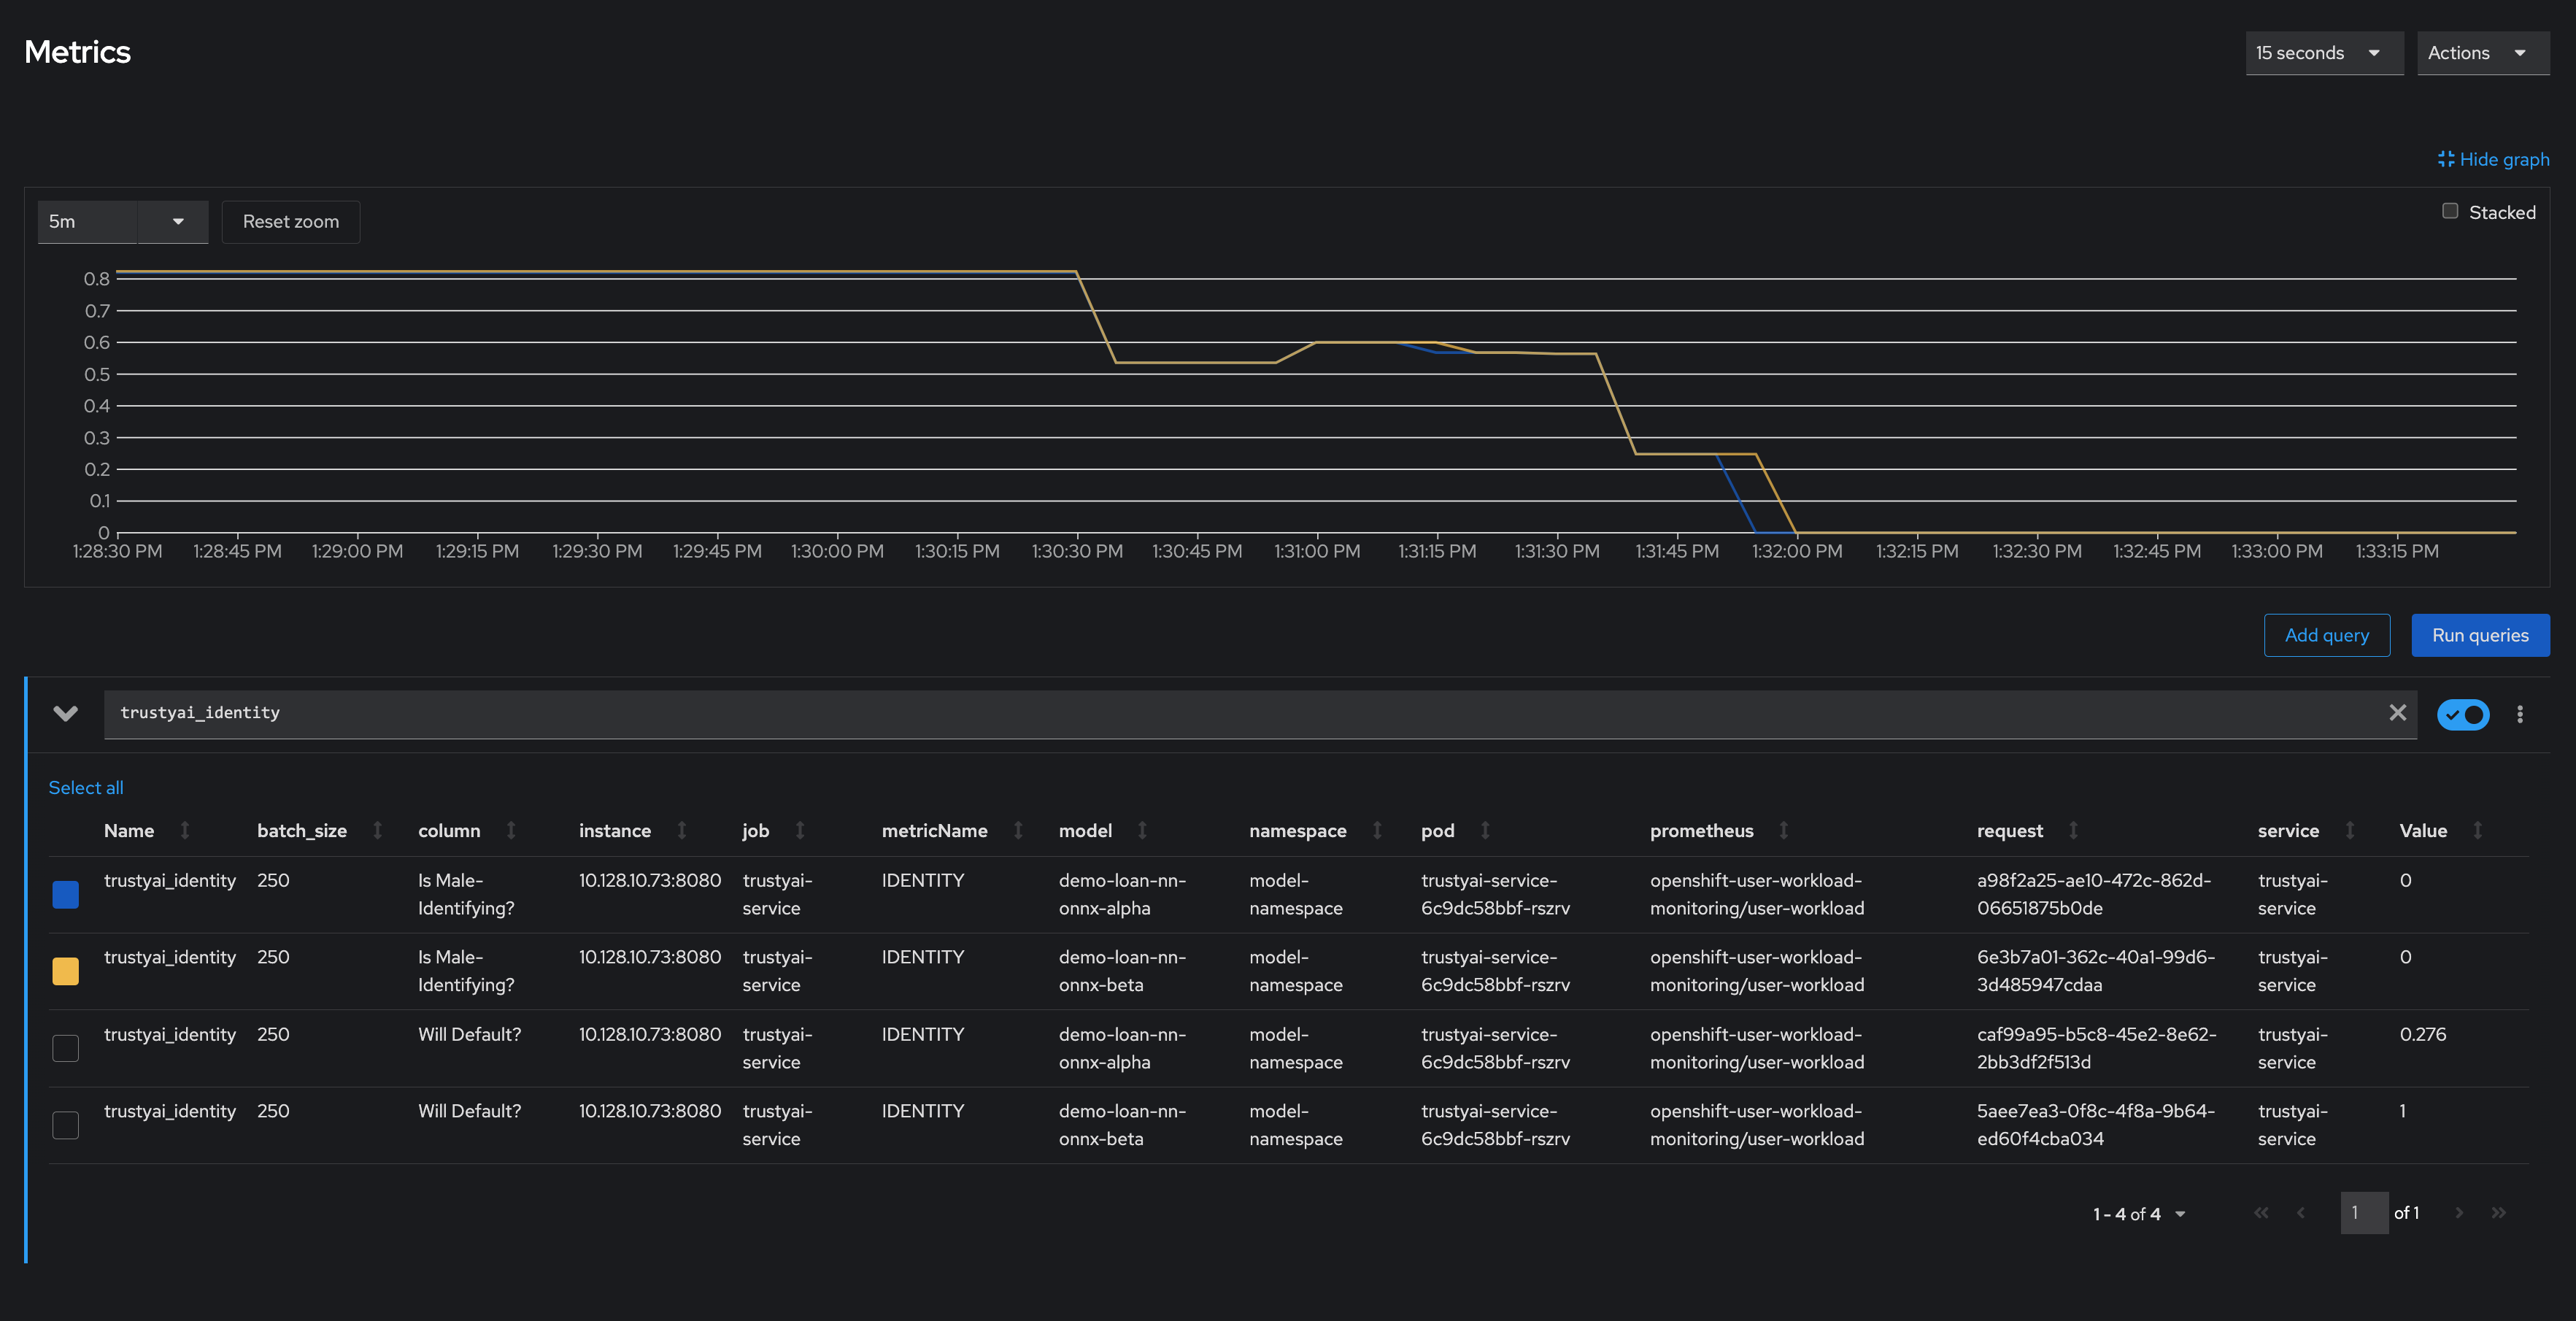
In the training data, the ratio between male and non-male was around 0.8, but in the real-world data, it dropped to 0, meaning all applicants were non-male. This is a strong indicator that the training data did not match the real-world data, which is likely to indicate poor or biased model performance.
How does the production data compare to the training data?
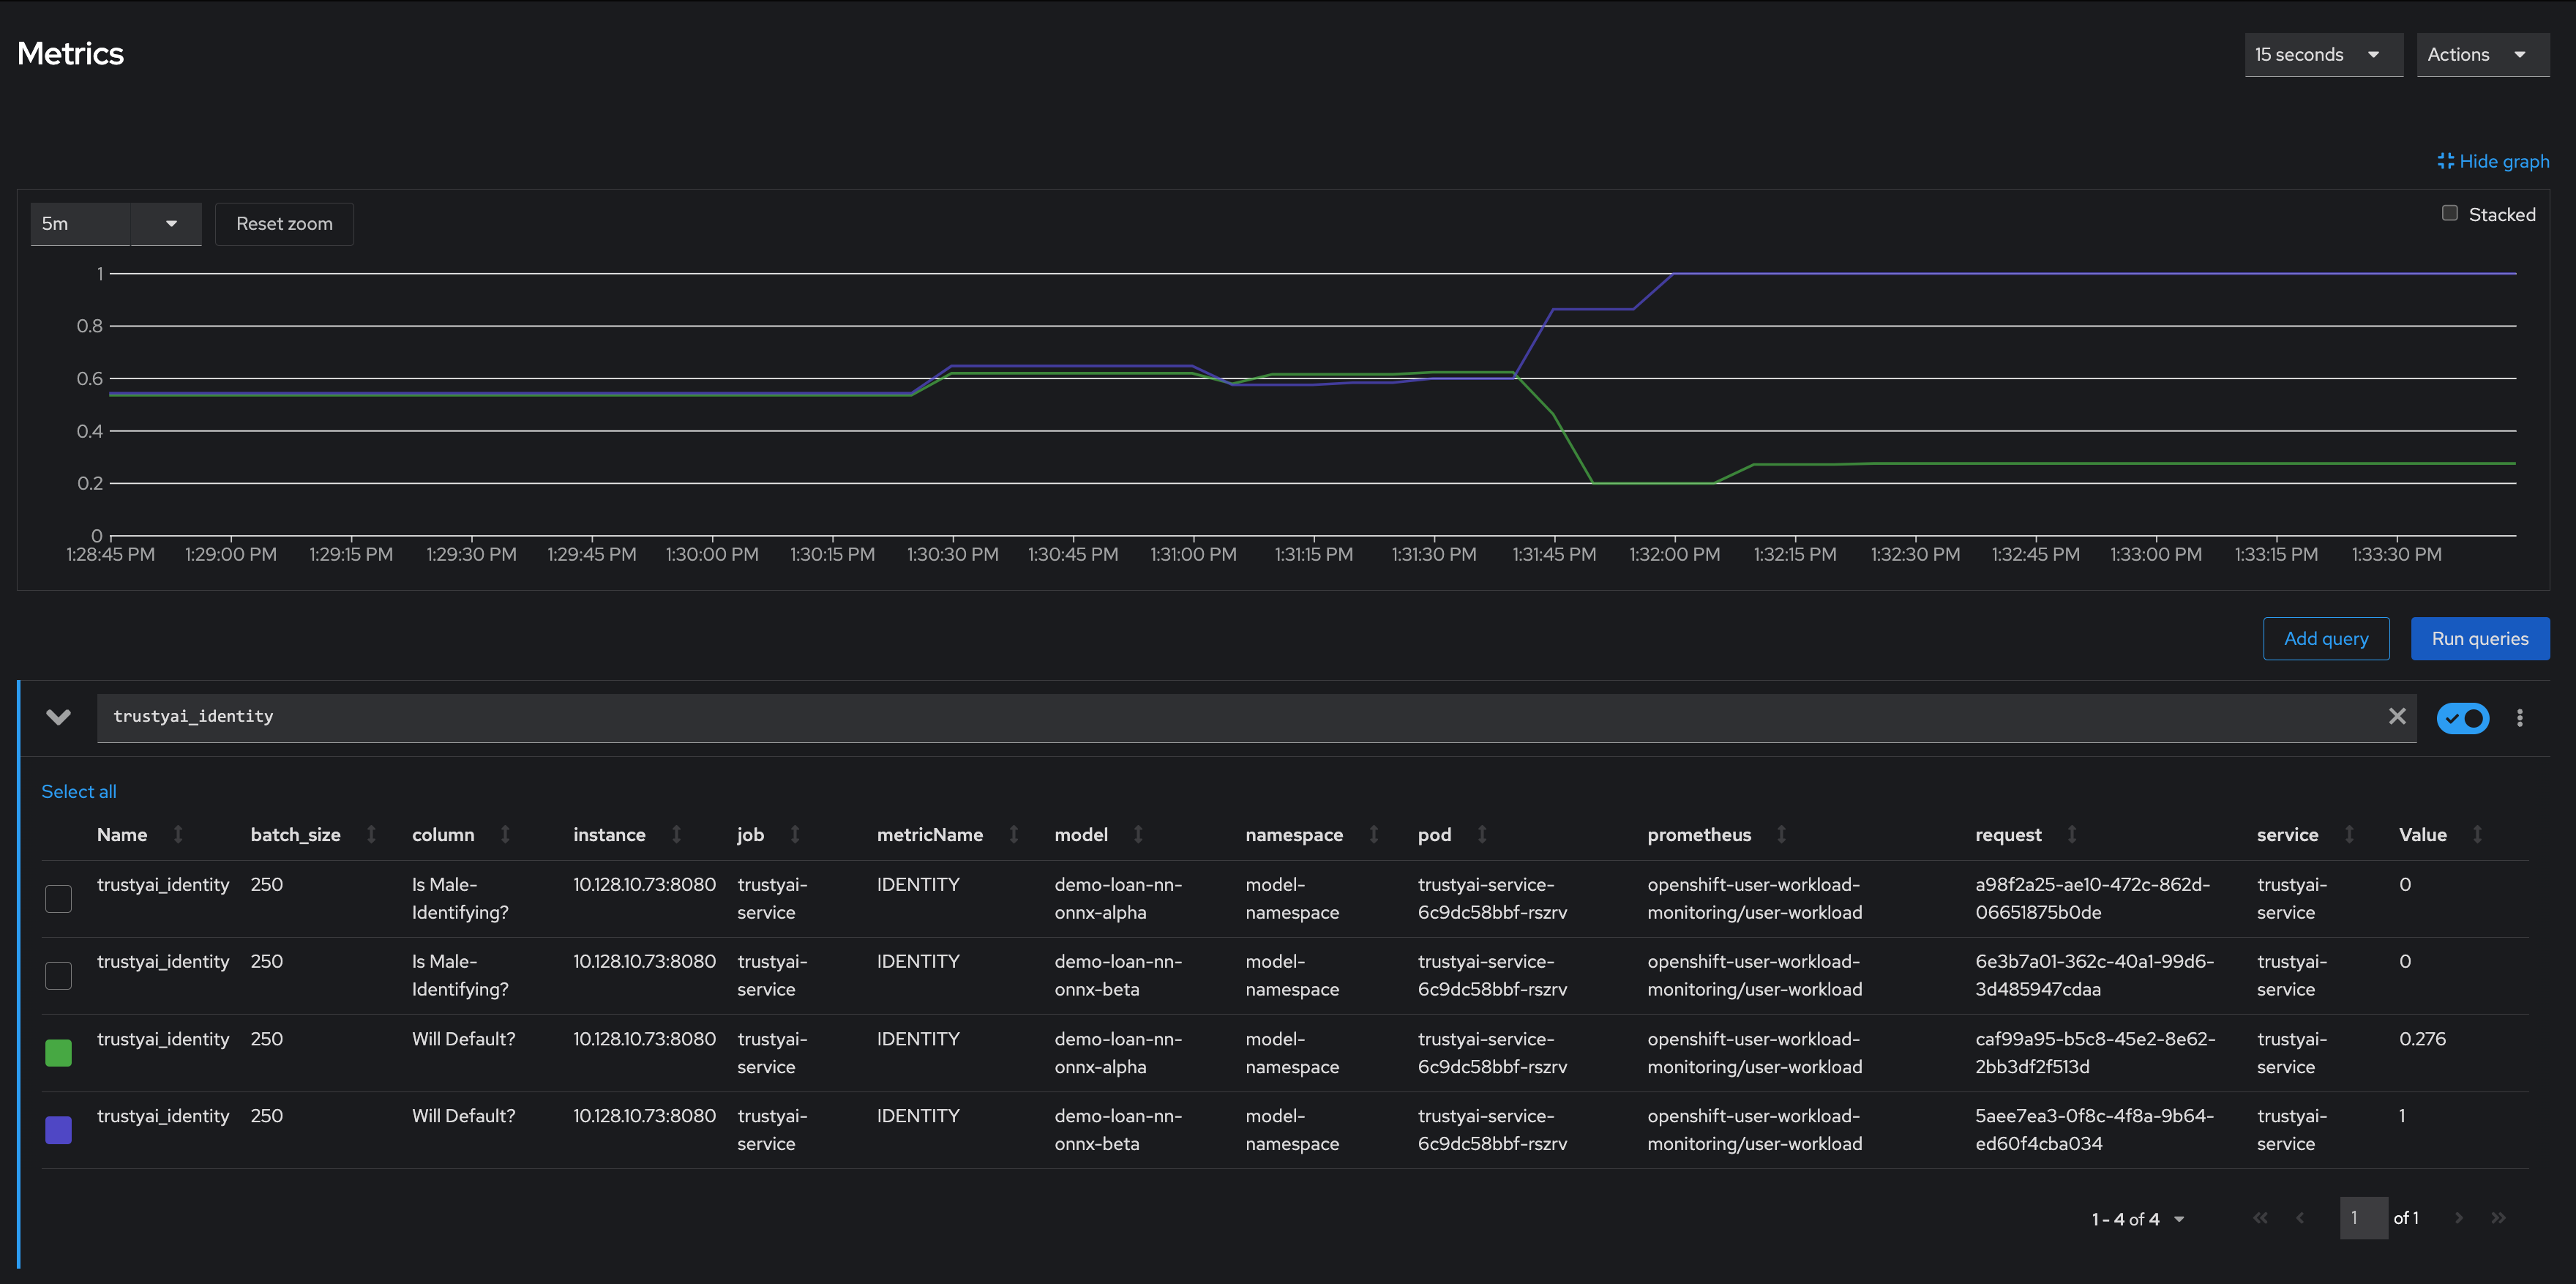
Even though Model Alpha (green) was only exposed to non-male applicants, it still provided varying outcomes to the various applicants, predicting "will-default" in about 25% of cases. In contrast, Model Beta (purple) predicted "will-default" 100% of the time, meaning it predicted that every non-male applicant would default on their loan. This suggests that Model Beta is performing poorly on the real-world data or has encoded a systematic bias from its training, leading to the assumption that all non-male applicants will default.
These examples highlight the critical importance of monitoring bias in production. Models that are equally fair during training can perform very differently when applied to real-world data, with hidden biases emerging only in actual use. By using TrustyAI to detect these biases early, you can safeguard against the potential harm caused by biased models in production.
1. Marco Tulio Ribeiro, Sameer Singh, Carlos Guestrin. "Why Should I Trust You?": Explaining the Predictions of Any Classifier." Proceedings of the 22nd ACM SIGKDD International Conference on Knowledge Discovery and Data mining, 2016. Pages 1135-1144.
2. Scott Lundberg, Su-In Lee. "A Unified Approach to Interpreting Model Predictions." Advances in Neural Information Processing Systems, 2017.
3. Avanti Shrikumar, Peyton Greenside, Anshul Kundaje. "Learning Important Features Through Propagating Activation Differences." CoRR abs/1704.02685, 2017.